How MemeLab outperformed published Ebola forecasts
Agent-based simulator MemeLab was closer than most published DRC Ebola forecasts and beat standard models on cases across 12 pathogens. Plus a 6-week forecast.
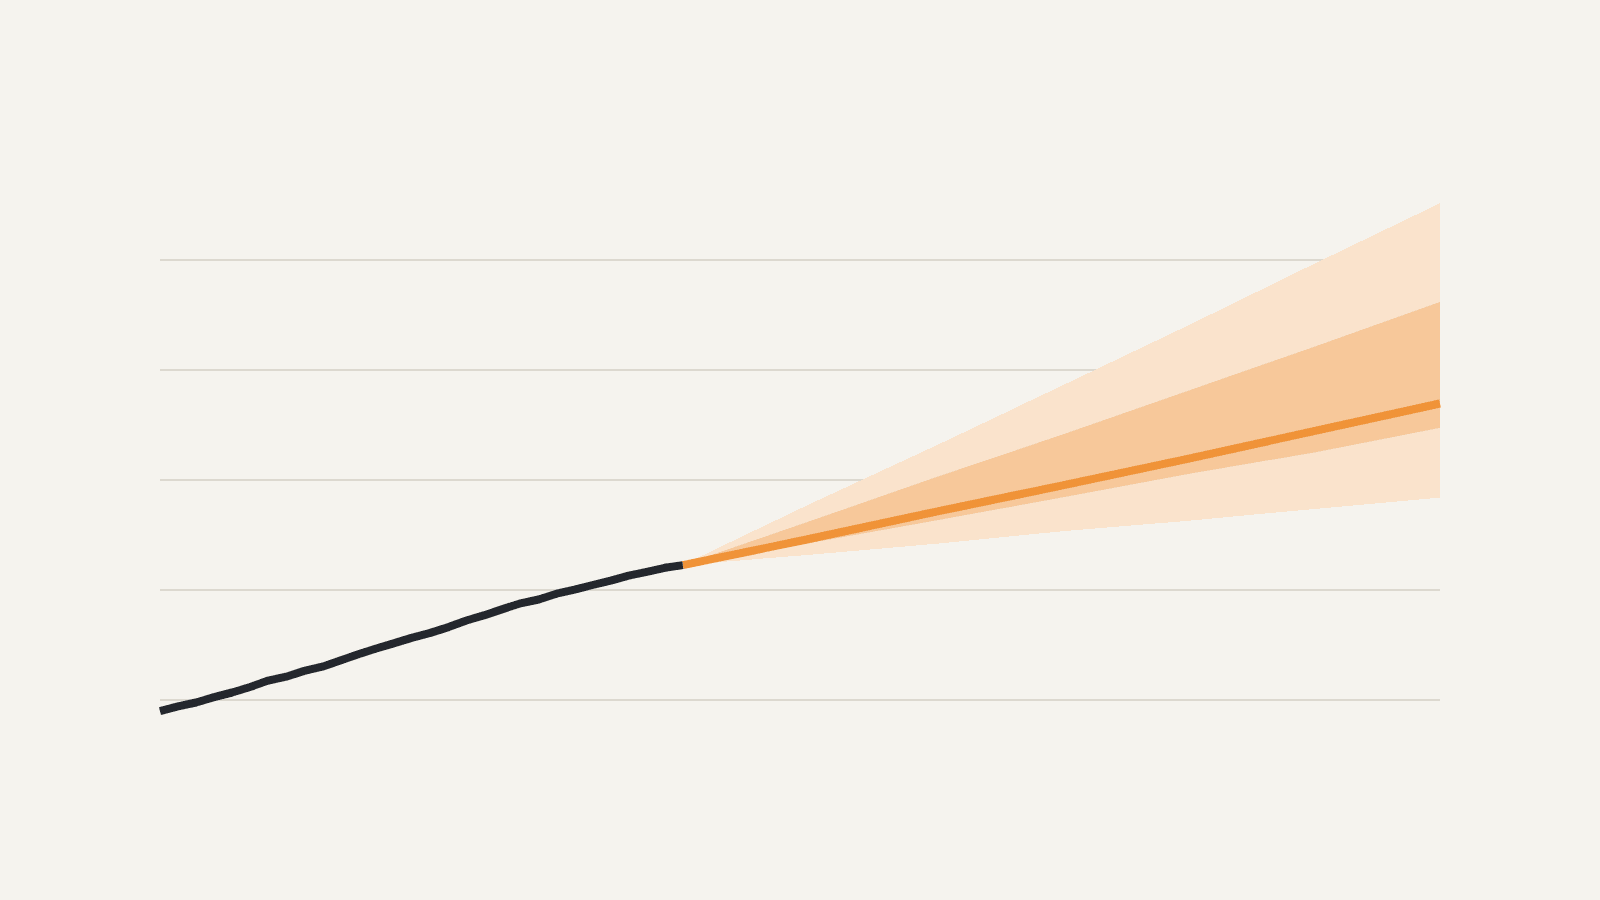
The 2026 Bundibugyo Ebola outbreak in the Democratic Republic of the Congo has drawn a steady stream of published forecasts. Research groups, forecasting platforms and journal papers have all put numbers on where it is heading. So I ran a simple test: give MemeLab, my browser-based epidemic simulator, exactly the data each published forecast had, ask it for the same date, and score both against what the DRC Ministry of Health later reported.
MemeLab's mean error was 8.3% on cases and 8.2% on deaths. The published forecasts, on the same forecasts, scored 13% and 12%. MemeLab was closer on 20 of 28 case forecasts and 13 of 17 death forecasts.
That is one result from a larger forecasting benchmark covering 12 pathogens and 15 real outbreaks. This post is the short version. The full report has every table, method and source. At the end is a frozen six-week forecast for the DRC outbreak, made with the best MemeLab model for the job.
Head to head with the published Ebola forecasts
The outbreak was detected on 14 May 2026 and declared the next day, and WHO declared it a public health emergency of international concern on 17 May. It is the DRC's 17th Ebola disease outbreak.
I catalogued 2,695 published entries about it and kept every forecast that states a cumulative count, a target date and the data cutoff behind it. Counterfactual scenarios, retrospective fits and modelled true-infection counts were dropped, and so were numbers labelled cumulative that sat below the count already reported when they were made (a different series). That leaves 45 scoreable forecasts so far. Each was scored against the first confirmed count the Ministry of Health reported on or after its target date.
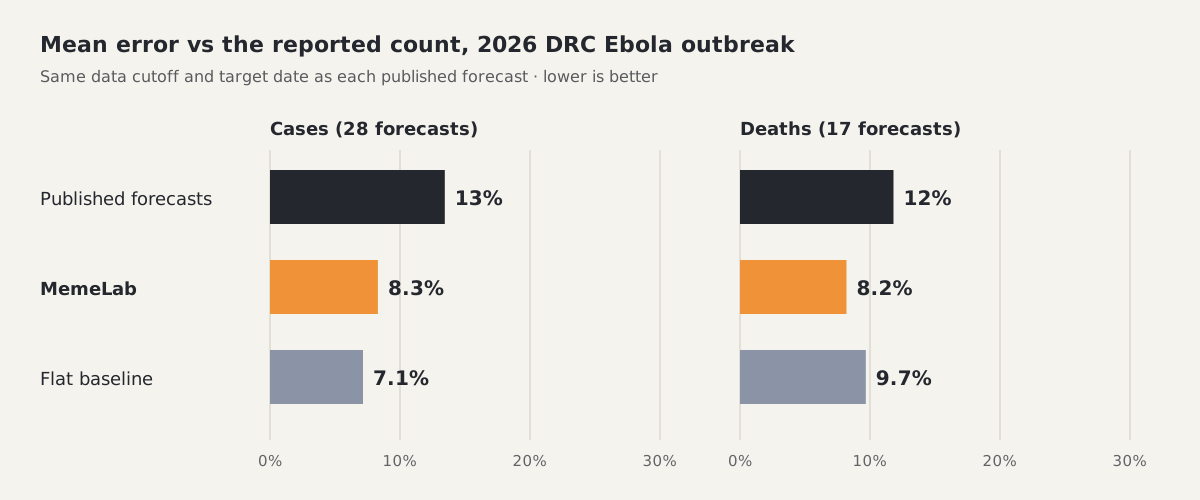
Mean error in the reported cumulative count, on the same 28 case and 17 death forecasts. Lower is better.
MemeLab's error was about 40% lower than the published forecasts on cases and about 30% lower on deaths. The most frequent published forecaster, the LSHTM epiforecasts renewal model, averaged 9.4% on its 27 scoreable forecasts; MemeLab averaged 3.3% on the same ones. MemeLab was also closer than the homogeneous-mixing compartmental model of Chamla et al. 2026 (18% vs 29%) and the Metaculus community forecasts.
Twelve pathogens, fifteen outbreaks
A single outbreak can flatter any model, so the DRC comparison sits inside a bigger suite. It covers 12 human-to-human pathogens: SARS-CoV-2, Zaire Ebola, Bundibugyo, Sudan virus, Marburg, mpox, SARS-CoV-1, MERS, pandemic H1N1 influenza, measles, diphtheria and pneumonic plague. They are tested on 15 real outbreaks and 122 forecast dates. Each forecast predicts the reported cumulative count 1, 2, 4 and 6 weeks ahead.
MemeLab goes up against the standard toolkit of outbreak forecasting: the Richards growth curve, a classic mean-field SEIR model, a renewal-equation Rt projection, the generalized growth model, and the flat baseline used by the COVID-19 Forecast Hub (next week looks like this week).
Six weeks ahead, on the test forecasts:
| Method | Cases, 6-week error | Deaths, 6-week error |
|---|---|---|
| MemeLab | 16% | 43% |
| Richards growth curve | 18% | 27% |
| Classic mean-field SEIR | 18% | 84% |
| Flat baseline | 19% | 48% |
| Generalized growth model | 33% | 96% |
| Renewal (Rt) projection | 74% | 137% |
MemeLab has the lowest six-week case error of every method. It beats the flat baseline at every horizon, on cases and on deaths. At one week its case error is 2.4%, against 3.6% for the flat baseline.
Then came the confirmation run. After the final configuration was chosen, I scored every method on 111 new forecast dates, each shifted a week from an original one: a second set of forecast dates not used by the selection rule. There, MemeLab's six-week error was 9.8% on cases and 16% on deaths. The flat baseline scored 16% and 21%.
Why a simulation of people forecasts well
Most outbreak models treat a population as one well-stirred pot, where anyone can infect anyone. MemeLab doesn't. It simulates individual people, each one a cell on a spatial grid or on an irregular network of settlements built from Voronoi cells. Infection moves through neighbours, plus a small share of long-range contacts.
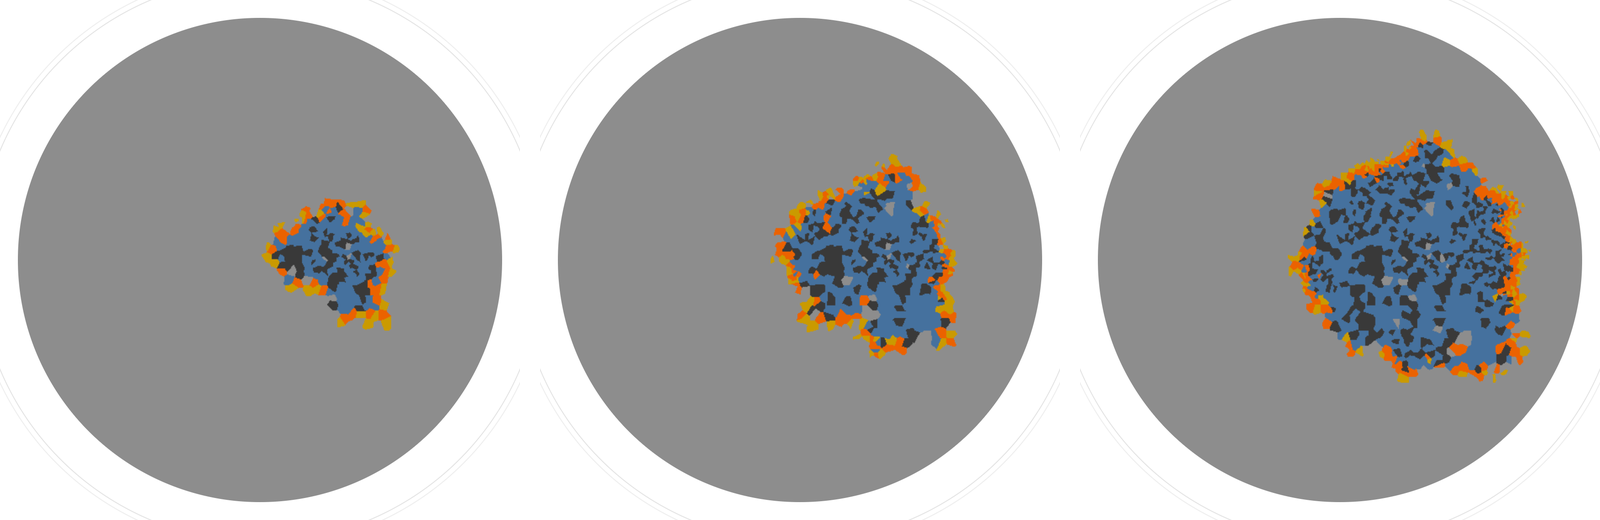
The Bundibugyo preset on a Voronoi settlement network, days 100, 140 and 180. Grey: susceptible. Yellow: exposed. Orange: infectious. Blue: recovered. Black: dead.
That structure matters, and the benchmark measures it. Run the same simulator recipe with everyone mixing with everyone, and the six-week death error rises from 44% to 67%. Death error is higher at every horizon without contact structure.
For each forecast, MemeLab is calibrated the way a person would do it by hand in the app:
- Cited biology: the latent and infectious stages are set so the simulated generation time matches each pathogen's published serial interval (for Bundibugyo, 6 and 10 days).
- Fitted start of transmission: the start is searched up to 24 weeks before the first report, not pinned to the first reported case. The simulation models the epidemic, not the surveillance record.
- Phased transmission: transmission is adjusted in three-week phases to follow the data.
- Ensembling: the headline forecast averages the simulator with the flat baseline. Simple equal-weight ensembles are hard to beat (Ray et al. 2023).
Where it doesn't win yet
- On six-week deaths across the suite, the Richards growth curve is better (27% vs 43%).
- On DRC cases, the flat baseline was slightly closer than MemeLab (7.1% vs 8.3%). On DRC deaths, MemeLab was better (8.2% vs 9.7%).
- On its own forecasts, the Bayesian model of Verheyden et al. 2026 was closer than MemeLab (9.5% vs 14%).
- The benchmark is retrospective: it is scored on final archived data, not on what was available on each date.
The next six weeks in the DRC
Through 21 September 2026, the DRC has reported 7,773 confirmed cases and 3,759 confirmed deaths (INSP SitRep 130; all sitreps on the INSP outbreak page).
The forecast below uses MemeLab, both networks: the grid and the settlement-network simulators, averaged with the flat baseline. It was picked by a fixed rule, the lowest error on this outbreak's past forecast dates (19%, against 21–23% for the other MemeLab variants).
| Week ending (2026) | Cases (median) | Cases, 90% range | Deaths (median) | Deaths, 90% range |
|---|---|---|---|---|
| 28 Sep | 8,165 | 7,930–8,683 | 3,952 | 3,808–4,219 |
| 5 Oct | 8,571 | 8,095–9,562 | 4,136 | 3,885–4,650 |
| 12 Oct | 8,965 | 8,281–10,458 | 4,332 | 3,954–5,093 |
| 19 Oct | 9,367 | 8,438–11,363 | 4,534 | 4,033–5,517 |
| 26 Oct | 9,783 | 8,616–12,289 | 4,723 | 4,098–5,977 |
| 2 Nov | 10,197 | 8,789–13,202 | 4,913 | 4,165–6,431 |
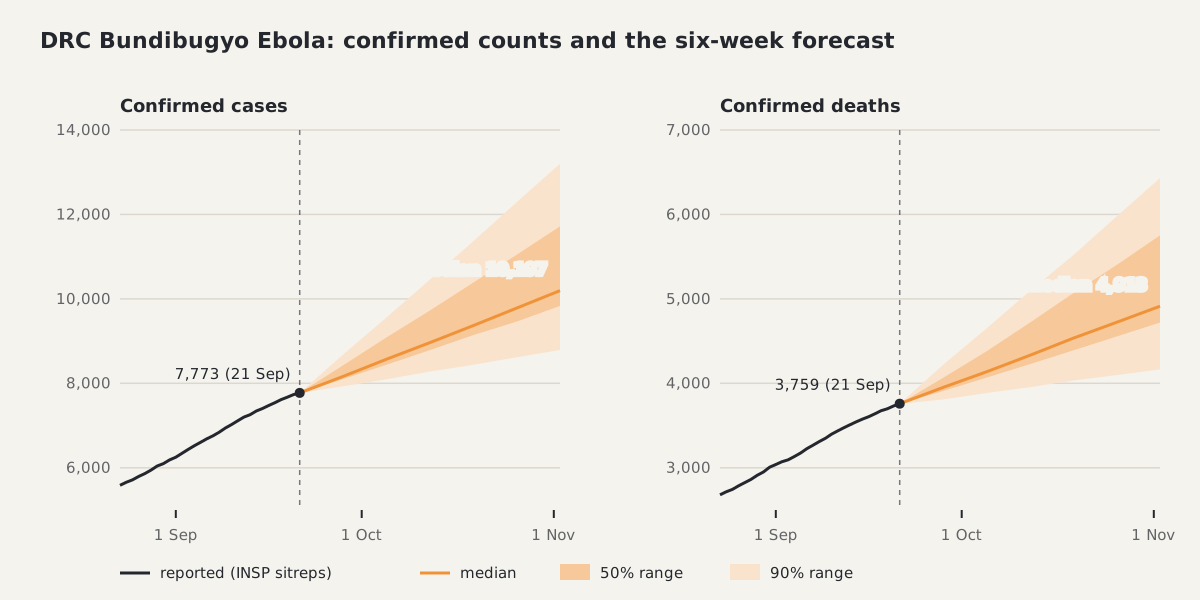
Confirmed counts from INSP sitreps (charcoal) and the forecast median with 50% and 90% ranges (amber).
By 2 November, MemeLab expects about 10,200 confirmed cases (90% range 8,789–13,202) and about 4,900 confirmed deaths (4,165–6,431).
This forecast is frozen. I will score it in public as the reports arrive, hits and misses alike. You can run the same Bundibugyo preset yourself at epi.meme, and the source is on GitHub.