Measles in upstate New York, 2026: a fit, four scenarios, a school
MemeLab fits the 2026 measles outbreak in rural upstate New York, runs four six-week scenarios with ranges, and models a hypothetical school.
New York State has a measles outbreak in 2026. It is in rural counties upstate, not in New York City. I took the state's published case counts and fitted MemeLab, my browser-based outbreak simulator, to them.
The short version: I fitted MemeLab to the 61 confirmed cases with onset from the week ending 1 August to the week ending 12 September 2026, in New York State outside New York City. The fit's running total stays within 3 cases of the reported total in every week. The fitted start of spread is 18 July on four of five runs. The model is not running out of people. It is a fit made after the fact, on few cases.
I then ran four scenarios six weeks ahead, to the week ending 14 November. These are scenarios under stated assumptions, not a prediction of what will happen. The dashboard shows 102 confirmed cases outside New York City, and allowing for late reports the scenarios start from about 130 (range 113 to 185). Across the four, the ranges together span about 160 to about 970 confirmed cases, with central values from about 260 to about 390. A check on the method gave central values about twice too high, so read the ranges, not the middles.
The post then asks a what-if about a hypothetical school, built to resemble schools in the state's survey; it is not any real school. In that survey, 3,914 of 4,202 schools report at least 95% of pupils immunised against measles, and 167 report under 80%. In the model, one case in a school where no pupil is immunised infects every pupil in every run. With 65% immunised, every unprotected pupil is still infected in almost every run. With 95% immunised the typical result is 3 or 4 cases (ranges 1 to 9 in a school of 64, 1 to 24 in a school of 324), and about a quarter of introductions stop at the first case. What decides the outcome in this model is how many pupils are immune on the day the virus arrives.
This post is education, not medical advice. For what to do, follow your health department (links below).
What measles is
Measles is a virus that spreads through the air. It can stay in the air "up to 2 hours after an infected person leaves an area", and up to 9 out of 10 unprotected people who are close to a case catch it (CDC clinical overview).
It is among the most contagious diseases known. The usual way to say how contagious is R0: the number of people one case infects when nobody around them is immune. For measles the commonly cited range is 12 to 18. That range comes from old data: the United States from 1912 to 1928 and England and Wales from 1944 to 1979 (Delamater et al. 2019). A review of 18 studies concluded that "R0 estimates vary more than the often cited range of 12-18" (Guerra et al. 2017). Models fitted to two recent outbreaks in the United States gave about 7 in one case and 7 to 16 in the other, with the public health response folded into the lower figure (Yang 2020; Gastañaduy et al. 2018).
The timings are well measured. The rash appears on average 14 days after exposure, with a range of 7 to 21 days. A person is infectious from 4 days before the rash appears through 4 days after (CDC Pink Book). The gap between one case and the cases it causes averages 11.7 days (Vink et al. 2014).
The vaccine works well. One dose of MMR vaccine is about 93% effective at preventing measles and two doses are about 97% effective (CDC).
New York State, 2026: what is known
Where and how many
The state health department describes cases in "rural areas in the Capital, Central and Western areas of the state" (press release, 24 August). New York City is a separate matter. It has 7 confirmed cases this year as of 2 October (NYC Health), and it "is not flagged as an area experiencing a measles outbreak" (Gothamist, 5 October).
As of 3 October the state counted 108 confirmed cases among its residents in 2026: 7 in the city and 101 in the rest of the state. Of these, 92 have been reported since 15 July "among under-immunized, rural communities in 18 counties" (Executive Order 65; Governor's press release, 5 October). The state's dashboard, updated on 6 October with the same data date, shows 102 outside the city, one more than the Governor's figure (dashboard). The counts are provisional.
On that dashboard the largest 2026 totals are Otsego (20), Seneca (18), Steuben (14), Wayne (8) and Allegany (6). Twenty-two counties outside the city have at least one case this year.
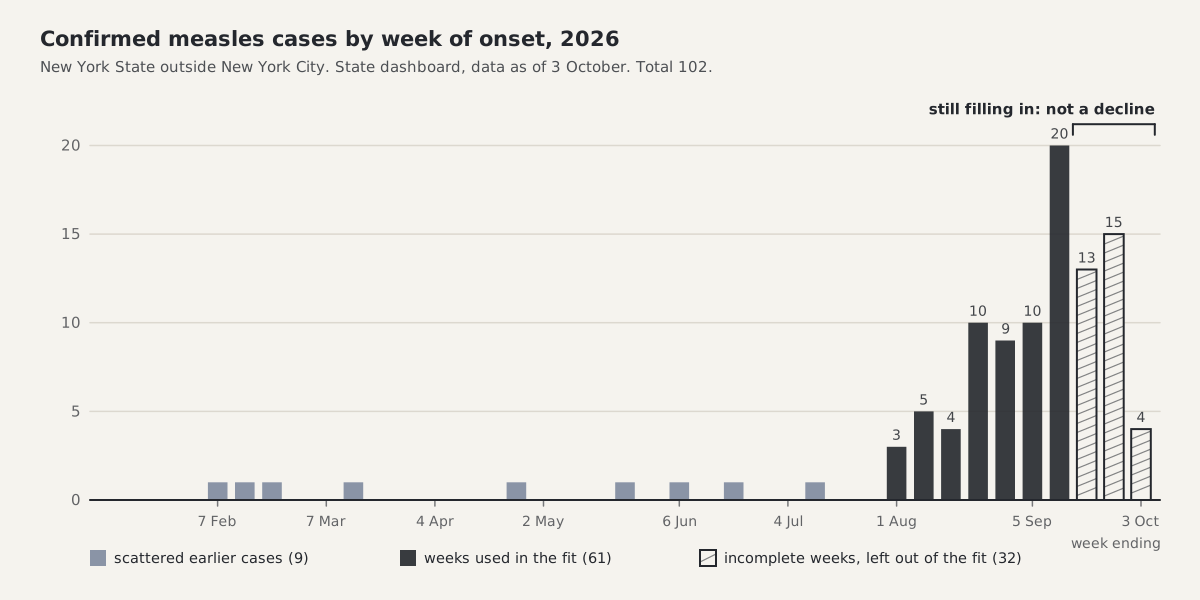
Confirmed cases outside New York City by week of onset, from the state dashboard. The hatched weeks are still filling in and say nothing about the trend.
Nine cases outside the city have onset dates between February and mid-July, about one at a time, scattered. The sustained rise begins in the week ending 1 August. The last two or three weeks on the chart are incomplete, because cases are reported one to three weeks after onset. One example: on 15 September the state had announced 51 cases outside the city, and the dashboard now places 70 onsets on or before 12 September. The dashboard itself says "Counts are likely to increase in subsequent updates."
How it started and who is affected
The state's advisory to doctors on 21 August said that since 13 July there had been "measles cases confirmed in unvaccinated individuals" in seven counties, and that "While a few cases have been associated with travel to other states, local transmission has also occurred." It also recorded "suspected under-reporting" (health advisory).
The state has not published a breakdown of cases by age, vaccination status or hospital admission. County officials in Steuben, Otsego and Ontario counties said all their cases were in unvaccinated people (WSKG; WBNG; 13WHAM). On hospital care there is one remark from the State Health Commissioner, Dr James McDonald, on 6 October: "One out of five cases are ending up in a hospital." The same report says he believes misinformation and vaccine hesitancy are partly driving the outbreaks (Spectrum News). No deaths have been reported in New York (New York Times via the Inquirer, 6 October).
The response
- 21 August: the state's advisory to doctors, with an outbreak-area vaccine schedule that includes an early dose at 6 to 11 months.
- 24 August: a public statement from the state on the rise in rural areas. Steuben County had 38 close contacts in quarantine that day (WSKG).
- 15 September: the state launched its weekly measles dashboard, and restated its guidance: "People who are exposed to measles should quarantine for 21 days after exposure and those who test positive should isolate until four days after the rash appears" (press release).
- 5 October: Governor Hochul declared a State Disaster Emergency for the whole state, in force until 4 November. She said more than 1,000 MMR doses had been given in rural areas since 15 July.
The disaster emergency is a legal tool. Under Executive Order 65, paramedics, advanced emergency medical providers, midwives and pharmacists (for children aged 2 and over) may give MMR vaccine, nurses may order tests, vaccinations must be reported to the state registries within 72 hours, and purchasing rules are eased. It does not order closures, quarantine or mandatory vaccination.
Vaccination coverage
The figure most often quoted is the share of children with at least one MMR dose by age 2, from the state's immunisation registry as of 1 January 2026. Outside New York City it is 80.9%. In the counties with the most cases it is 77.5% in Otsego, 71.2% in Seneca, 79.1% in Steuben, 82.2% in Wayne and 77.3% in Allegany. The lowest county figure is 52.9%, in Yates (state vaccine page).
Those figures measure one thing: two-year-olds, one dose, in a registry the state says "may be underestimated" in some counties. They are not the vaccination rate of a county. Coverage at school is much higher in most places. In the state's 2025-26 school survey, 3,914 of 4,202 schools report at least 95% of pupils immunised against measles, and 167 report under 80% (school survey data; my count of schools, not weighted by enrolment). So protection is high on average and very uneven. That unevenness is the subject of the what-if later in this post.
The wider picture
Next door, Pennsylvania reported 977 confirmed cases in 39 counties, 195 hospital admissions and 5 deaths as of 2 October (Pennsylvania Department of Health). The New York order cites that outbreak "in rural counties that border New York State" as one reason for the emergency. I found no official statement that cases in the two states are linked by laboratory or case investigation. Nationally, CDC counted 3,887 confirmed cases in 2026 as of 1 October (CDC).
What is not known
The ages of the people infected, how many were vaccinated, and how many were admitted to hospital have not been published for the state. There is no official definition of which cases belong to the outbreak. The weekly curve rests on the current dashboard and one earlier copy of it. The state suspects that some cases are not being reported. I found no official projection for this outbreak. The scenarios later in this post are mine, not official.
Official guidance
This post is not medical advice. The state says: "Anyone who has not been vaccinated against measles should receive at least one dose of MMR vaccine. However, two doses of MMR vaccine are recommended for all children and adults." If you think you were exposed: "Immediately call your local health department or health care provider for advice." The guidance is on the New York State Department of Health measles page, from your county health department, and from CDC.
The recreation, fitted to the data so far
MemeLab simulates individuals on a grid. Each one is susceptible, incubating, infectious or recovered, and infectious individuals infect neighbours and, occasionally, someone far away. I gave it three sourced inputs.
- The cases: confirmed cases outside New York City by onset week, from the state dashboard. I used the seven weeks from the week ending 1 August to the week ending 12 September: 3, 5, 4, 10, 9, 10 and 20 cases, 61 in all. The three most recent weeks were left out because they are still filling in. The nine scattered earlier cases were left out as separate introductions.
- The infectious period: 9 days, CDC's window of 4 days before the rash to 4 days after.
- The latent period, the time from infection to becoming infectious: 7 days. I set it so that the gap between one case and the next in the simulator is 12 days, to match the measured 11.7. The simulator spreads infectiousness evenly over the 9 days, so the clinical figure of about 10 days would make each generation three days too slow. The model has no symptoms, so this is not a claim about when the rash appears.
Both durations are fixed. They are never tuned to make the curve fit. I applied no correction for missed cases: under-reporting is suspected, but nobody has published a ratio.
Everything else is fitted, by the same recipe I use for every pathogen: how easily the infection passes between neighbours, how often it jumps across the grid, when transmission started, and how many real people one simulated cell stands for. The recipe can also place generic slow-downs, but its rule gives none in a window as short as six weeks. I ran the fit five times with five random seeds.
Vaccination coverage does not enter this fit. The simulated individuals stand for the people the outbreak can reach and infect, whoever they are.
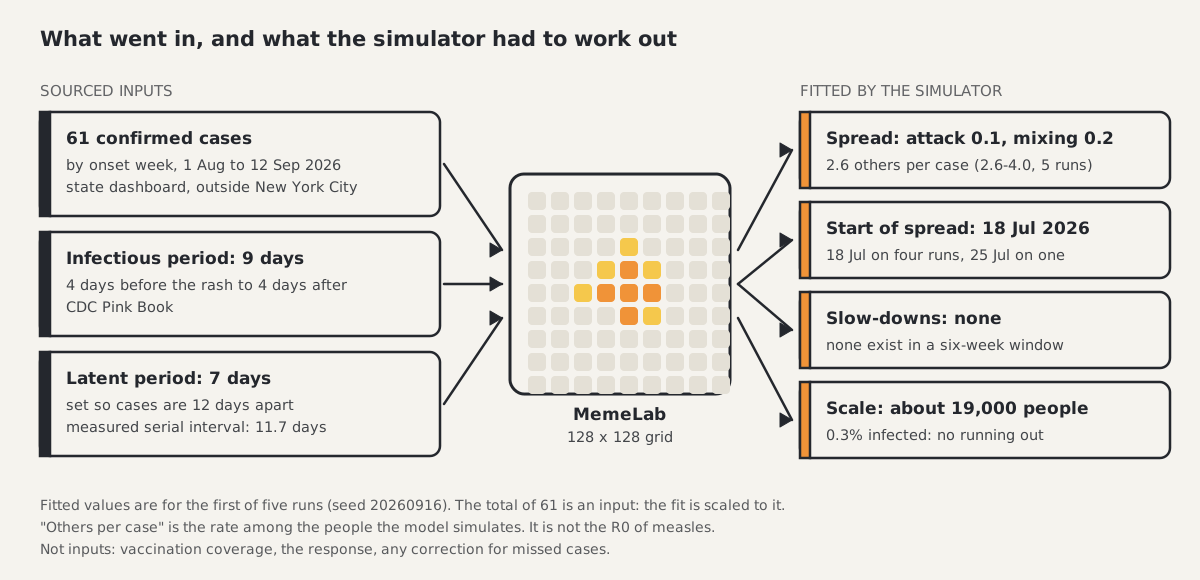
Sourced inputs on the left, fitted values on the right. Nothing on the right is a measurement.
This is a fit to date, made after the fact. The simulator saw every fitted week before producing its curve, and this fit produces nothing after 12 September.
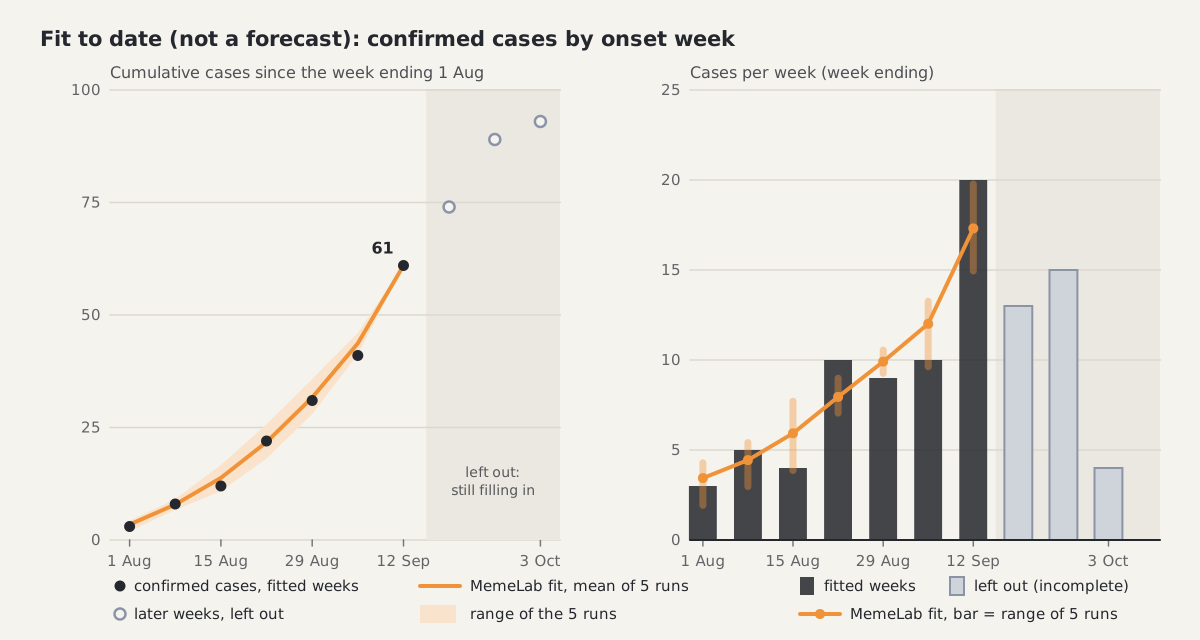
Left: cumulative cases from the week ending 1 August. Right: cases per week. The grey weeks were left out of the fit because they are incomplete.
The rebuilt total is 61 because the fit is scaled to the data. That match is not a result. What the model found:
- The fit's running total stays within 3 cases of the reported running total in every week. In percentage terms that is a median of about 4% over the six weeks that the scaling does not fix.
- Week by week, the fit differs from the data by about 17% of all cases (14 to 22% on single runs). With weekly counts between 3 and 20 that is less than chance alone would produce: counts scattered at random around this same curve would differ by about 25%. The data jump from 10 to 20 in the last fitted week; the fit reaches about 17.
- The fitted start of spread is 18 July on four of five runs and 25 July on the fifth, by date of onset. Infections came about 10 to 14 days before onsets. The state dates this phase of the outbreak from 15 July.
- In the model each case infects about 2.6 to 4 others at the start. That is the rate among the people the model simulates, who stand for those the outbreak can reach. It is not measles' R0 of 12 to 18, and it does not say what share of people are immune.
- The model is not running out of people: under 1% of its fitted population is infected by 12 September (0.2 to 0.5% across the five runs).
The cautions, plainly:
- It rests on few cases and few simulated individuals. Between 32 and 83 simulated individuals stand for the outbreak.
- Several quite different settings fit almost as well. On each run, 12 to 16 of the 135 settings searched fit nearly as well as the best one. They include earlier starts, as far back as May, with a small pool of people that is already being used up. Sixty-one cases over seven weeks cannot tell those stories apart.
- It is one snapshot of a dashboard, with no correction for missed cases, on onset dates.
- With the following week added (74 cases, a week that may be incomplete), the fit keeps the same start date and gives 2.5 to 4 others per case.
- It is a fit after the fact, not a forecast.
Run it in your browser
One representative run of the fit opens in the app from a link: open the New York 2026 measles fit in MemeLab.
The link sets a 128 by 128 grid, attack rate 0.1, mixing 0.2, latent period 7 days, infectious period 9 days, one first case and the run's seed, and the run starts by itself. It does not carry the calendar, the population scale or the data, and it plays a single run where the fit averages several. In this run, day 7 is 1 August and day 49 is 12 September. It comes from the run whose fitted start was 25 July. At day 49 it has 31 infected cells, which is about 60 cases at that run's scale of 1.9 people per cell, against 61 in the data. Stop at day 49. Anything the app shows after that is not part of the recreation.
Six weeks ahead: four scenarios, not a prediction
The fit above stops on 12 September. This section looks six weeks past the data, to the week ending 14 November. These are scenarios under stated assumptions, not a prediction of what will happen. Each one is a what-if with a range. The ranges are ranges of this model's runs under each assumption. They are not the chance that the real count lands inside.
Where the scenarios start
The state dashboard shows 102 confirmed cases outside New York City with onset to 3 October. The most recent weeks are still filling in. Allowing for late reports, the scenarios start from about 130 (range 113 to 185).
The allowance rests on one earlier copy of the dashboard's weekly chart, kept by the Internet Archive, with data to 12 September (archived chart). It showed 3 cases in its newest week, where the current chart has 20, and 8 in the week before, where the current chart has 10. Older weeks changed by at most one case. From that I assumed the newest week on the current chart shows 5 to 40% of its eventual count, the week before 45 to 85%, and the week before that 85 to 100%. That turns the dashboard's 13, 15 and 4 into about 14 (range 13 to 17), 23 (17 to 36) and 21 (8 to 79).

One pair of snapshots is weak evidence, and the estimate is probably low. One county's own page showed 13 confirmed cases on 7 October where the state dashboard has 2 (Lewis County Public Health).
For the scenarios I refitted the simulator to all ten weeks, with the three recent weeks as estimates that count for less. I used 320 runs for each setting where the recreation used 8, and I kept every setting that fits nearly as well as the best one, 17 of 168, where the recreation kept one. The counts are confirmed cases by week of onset, as the dashboard should eventually show them once late reports are in. The total announced on any given day is lower.
The four scenarios
I fixed the four scenarios and their ranges before running them.
- Current course. Spread goes on at the average rate of August and September. Nothing changes after 3 October. This rests on the fit alone, and that average already includes the response so far.
- Response takes hold. The emergency order and the vaccination effort cut transmission by 40 to 60% from 17 October, by date of onset. The size comes from Pennsylvania this year, where the rough reproduction number went from about 2 while cases grew to about 1 at the plateau. That is my arithmetic from Pennsylvania's onset curve, not a published estimate. A 2014 outbreak in Ohio did much better, from about 4 to below 1 within about 30 days, with 27% of residents vaccinated in three months (Gastañaduy et al. 2018). Nothing on that scale is reported for New York, so I did not assume it. The date is an assumption: the order is dated 5 October, and infections avoided from then show up as missing onsets about 12 days later.
- The pocket runs low. The outbreak is running out of people it can still reach. Transmission shrinks in step with the share of that pocket still uninfected, and the pocket holds 1.5 to 4 times the cases so far. This is an assumption with a stated range. Outbreaks that ended within months finished at 1.4 times their count at this stage (West Texas 2025), 1.8 times (Ohio 2014), 2.8 times (the Netherlands 2013) and 3.4 times (Rockland County 2018-19). Others went on to 8 to 14 times or more.
- Wider spread. The pessimistic one: the virus keeps reaching new under-vaccinated settings. It is the current course plus 0.5 to 2 new, separate introductions a week. The dashboard gained five new counties between 12 September and 3 October, about 1.7 a week. The rate is an assumption, and it counts some spread twice, because spread to new counties is already inside the fitted rate. That is what makes it pessimistic.
Not in any scenario: school or childcare measures (I found none), changes in testing, and holidays.
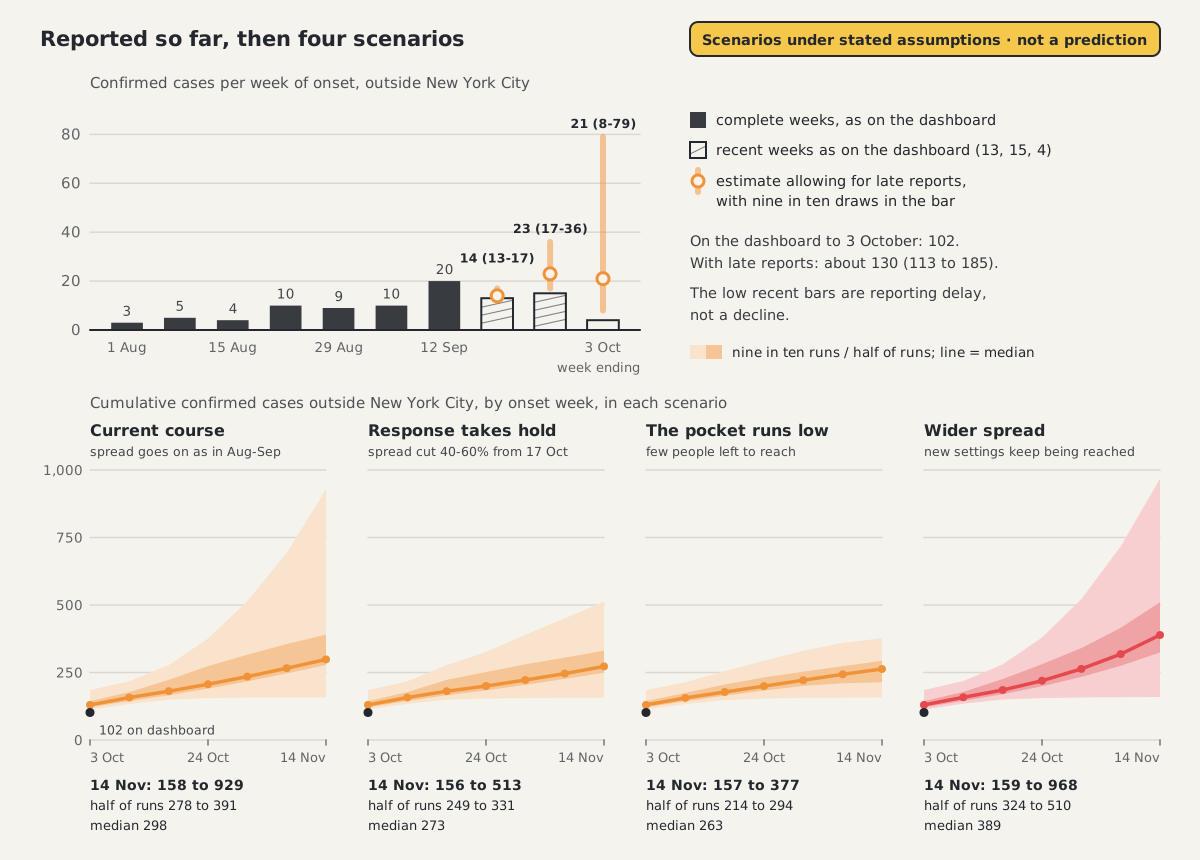
Top: cases by week of onset. Solid bars are complete weeks; hatched bars are recent weeks as the dashboard shows them, with my estimate and its range above. Bottom: cumulative confirmed cases in each scenario on a linear scale. The pale band holds nine in ten of the model's runs, the darker band half of them. These are scenarios under stated assumptions, not a prediction of what will happen.
What the scenarios give
Cumulative confirmed cases outside New York City by the week ending 14 November, by week of onset, the nine earlier cases of 2026 included:
| Scenario | Nine in ten runs (90% range) | Half of runs (50% range) | Median |
|---|---|---|---|
| Start: onset to 3 October | 113-185 | 121-144 | 130 |
| Current course | 158-929 | 278-391 | 298 |
| Response takes hold | 156-513 | 249-331 | 273 |
| The pocket runs low | 157-377 | 214-294 | 263 |
| Wider spread | 159-968 | 324-510 | 389 |
In words:
- In the "current course" scenario, where spread continues at the average rate of August and September, nine in ten of the model's runs put the total between 158 and 929 by the week ending 14 November, and half put it between 278 and 391. The central value is about 300.
- In the "response takes hold" scenario, where the emergency measures cut transmission by 40 to 60% from mid-October, nine in ten runs fall between 156 and 513 and half between 249 and 331. The central value is about 270.
- In the "pocket runs low" scenario, where the outbreak is running out of people it can reach, nine in ten runs fall between 157 and 377 and half between 214 and 294. The central value is about 260, and new cases per week are shrinking by mid-November in that scenario.
- In the "wider spread" scenario, the pessimistic one, where the virus keeps reaching new under-vaccinated settings, nine in ten runs fall between 159 and 968 and half between 324 and 510. The central value is about 390.
Across the four scenarios the ranges together span about 160 to about 970. The central values run from about 260 to about 390, roughly two to three times the starting estimate of about 130. The response and pocket scenarios differ from the current course mainly at the top: they bring the upper end of the nine-in-ten range down from about 930 to about 510 and about 380.
Why the ranges are so wide
The wide ranges are honest: with about 130 cases, the model cannot tell a slowly spreading outbreak from one about to accelerate or one about to run out of people. The settings I kept are of three kinds, and the data fit all three about equally well.
- Spread to neighbours only, with almost none of the model's population used up: 58% of the draws. This grows steadily.
- Spread with long-range jumps, again with almost none of the population used up: 23% of the draws. This grows exponentially.
- An early start, in May, in a small population that is already 17 to 75% infected: 19% of the draws. This stops almost at once.
The bottom of every range (about 156 to 159) comes entirely from the third kind. The top of the "current course" and "wider spread" ranges, over 900, comes entirely from the second. Most draws are the steady first kind, which is why the half-of-runs ranges are narrow. They are half of this model's draws, not half the time in the real world.
Two checks
A check on the method: fitted only to data through 22 August and run three weeks ahead under the "current course" scenario, it projected 17, 25 and 36 new cases a week (ranges 3-42, 1-92 and 0-181) where 9, 10 and 20 were later reported. The reported counts were inside the ranges, but the central values were about twice too high. The check was kinder than real time would have been, because no dashboard snapshot from 22 August exists and I used the counts shown now. The simulator's record on other outbreaks is mixed: on past measles outbreaks it did about as well as the simplest assumption, that next week repeats this week.
A check against experience: comparable outbreaks grew between 1.1 and 5.6 times over the same six-week stage. The scenarios' central values (2.0 to 3.0 times) sit in the middle of that. Pennsylvania's outbreak this year grew 3.5 times (Pennsylvania measles dashboard), and South Carolina's in 2025-26 grew 5.6 times (South Carolina Department of Public Health). Both are above the "current course" central value of 2.4 times and inside its nine-in-ten range of 1.3 to 7.7 times. Both smouldered for about three months and then took off, which the steady kind of fit does not do. The top of the "current course" and "wider spread" ranges is beyond any comparable outbreak I found. These comparisons are outbreaks that became large. Most introductions of measles do not.
What would make each scenario wrong
- Current course: anything changing. The response bites, the pocket empties, or spread reaches a large new group. It is also wrong if the fitted rate is off because the last three weeks are estimates, or because more testing (the order expands it) lifts confirmed counts without more infections.
- Response takes hold: nothing changing on the ground from 5 October, or the effect arriving later. In Pennsylvania it took about 16 weeks from the start of the outbreak to the plateau. The size could be off in either direction.
- The pocket runs low: the people who can be reached being many more than 1.5 to 4 times the cases so far. Nothing measures that number for New York, and 22 counties with cases argue against one small pocket.
- Wider spread: introductions into new settings slowing down, or landing where most people are vaccinated and going nowhere.
- All four: the allowance for late reports being off, many cases never being confirmed, or something outside the model, such as school measures, holidays, one very large exposure, or a change in how cases are counted.
The response plans behind the scenarios
The plans, as published by 7 October:
- Executive Order 65 is dated 5 October and is in force until 4 November. It widens who may vaccinate and test and eases purchasing. It contains no clinic schedule, dose target, funding figure, school measure or quarantine order, and the state has announced nothing more specific since.
- The Governor's figure of more than 1,000 MMR doses in rural areas has no end date, county breakdown or population to divide by, so it cannot be turned into a coverage figure.
- Counties are running clinics. Chautauqua County lists measles immunisation clinics on 2 and 9 October and mobile clinics on 8, 13, 14, 21 and 28 October (county clinic listing). Seneca County's health department reports 135 MMR doses given by its staff in 2026, 61 of them in September (county dashboard).
- The state dashboard is updated on Tuesdays. The next update is due on 13 October.
I will redo the late-report allowance and the scenarios after that update.
A hypothetical school: a model, not a forecast
Everything above is about a real outbreak with real reports. This section is not, and it is separate from the scenarios. It is a what-if for a hypothetical school: a speculative model, for education, not a forecast. It asks what one arriving case of measles does inside a school, and how much the answer depends on how many pupils are immunised.
The school is a hypothetical school, built to resemble schools in the state's survey; it is not any real school.
What the school survey shows
In the state's 2025-26 school survey, 3,914 of 4,202 schools report at least 95% of pupils immunised against measles. 167 report under 80%, and 76 report none at all. The low-coverage schools whose size could be found are small: typically about 24 pupils (school survey data).
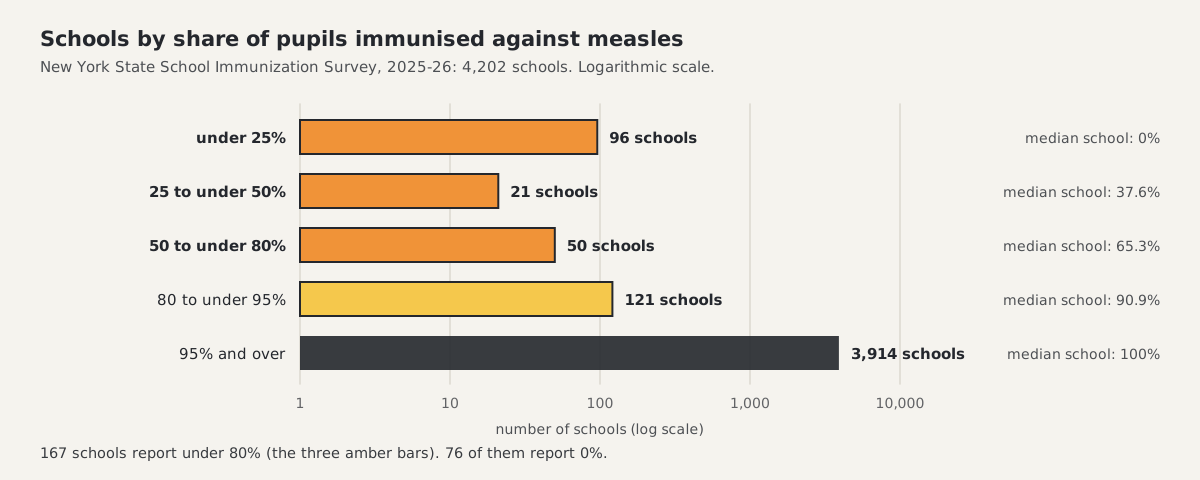
Schools by the share of pupils they report as immunised against measles. The scale is logarithmic so that the low bands are visible. The counts are my tabulation of the state's file.
The survey gives no pupil numbers. Matching schools to the state education department's enrolment files (non-public, public) gave a size for only 61 of the 167 schools under 80%, and for 14 of the 76 that report none. The ones that matched are small, with a median of 24 pupils, and most are listed with grades 1 to 8 and about 3 pupils per grade. The sizes of the other 106 are not known. Two indirect checks suggest they are similar, which is support, not proof. For contrast, the median public elementary school in 11 of the affected counties has 336 pupils, in classes of 14 to 15.
What I assumed
I wrote the method down before running it, and changed no setting afterwards.
| Item | Assumption | Where it comes from |
|---|---|---|
| Sizes | two schools: 64 pupils and 324 pupils, one simulated cell per pupil | 64 is the smallest school the simulator can make (an 8 by 8 grid). The typical matched low-coverage school has about 24 pupils, which it cannot represent, so 64 stands for the upper end of that kind of school. 324 is the nearest square grid to the 336-pupil median |
| Structure | a grid: each pupil's close contacts are the 24 nearest pupils in the small school and the 12 nearest in the large one, plus one contact a day with a random pupil anywhere in the school | classes of 14 to 15 in state data; the rooms of the small school are my inference from 3 pupils per grade |
| Who is in it | pupils only: no teachers, no households, no community | a limit of the model |
| Share immunised | 0%, 37.6%, 65.3% and 90.9% (the median school in each survey band), 95% (the usual target) and 100% (the median school statewide) | the survey |
| Protection | 97% of immunised pupils are fully immune, placed at random | New York requires two doses from kindergarten to grade 12; two doses are 97% effective (CDC) |
| Spread rate | R0 18, the most contagious end of the cited range; 12 and 7 as lower values | pessimistic choice |
| Timings | latent period 7 days, infectious period 9 days | as in the recreation |
| Start and runs | one first case on day 0, a random pupil; 400 random runs for every combination; until the outbreak ends or 84 days | chosen for the scenario |
Protected pupils are treated as fully immune. The app's vaccine setting can also work per contact, but with a virus this contagious and many contacts that version puts many of the model's infections in vaccinated people, which is not what officials report.
Because 64 pupils is more than the typical low-coverage school has, the counts for the small school are too large for a typical one. Shares travel better than counts.
What the model shows
In this model, one case of measles in a hypothetical school where no pupil is immunised infects every pupil, in every one of 400 runs, within about six to seven weeks.
| Share immunised | 64 pupils: infected, median (nine in ten runs) | Unprotected pupils infected | Stops at the first case | 324 pupils: infected, median (nine in ten runs) | Unprotected pupils infected | Stops at the first case |
|---|---|---|---|---|---|---|
| 0% | 64 (64-64) | 100% | 0% | 324 (324-325) | 100% | 0% |
| 37.6% | 41 (34-48) | 100% | 0% | 206 (192-219) | 100% | 0% |
| 65.3% | 24 (18-31) | 100% | 0% | 120 (105-136) | 100% | 0% |
| 90.9% | 7 (1-13) | 88% | 12% | 25 (1-44) | 66% | 12% |
| 95% | 3 (1-9) | 60% | 23% | 4 (1-24) | 14% | 24% |
| 100% | 1 (1-4) | 0% | 60% | 1 (1-5) | 0% | 57% |
"Unprotected pupils infected" is the median share. "Stops at the first case" is the share of the 400 introductions that infect nobody else.
- With 65% of pupils immunised, every unprotected pupil is still infected in almost every run: a median of 24 of 64 pupils (range 18 to 31) in a small hypothetical school and 120 of 324 (range 105 to 136) in a large one.
- With 95% immunised, the typical result in this model is 3 or 4 cases (ranges 1 to 9 in the small school, 1 to 24 in the large one), and about a quarter of introductions stop at the first case.
- With every pupil immunised, 6 in 10 introductions stop at the first case and nearly all (96 to 98%) stop within five cases, because two doses protect about 97% of pupils, not all.
- A less contagious setting changes little where few pupils are immunised. It matters in the middle: with 65.3% immunised and R0 7, the large school's median is 62 (range 2 to 109) where R0 18 gives 120.
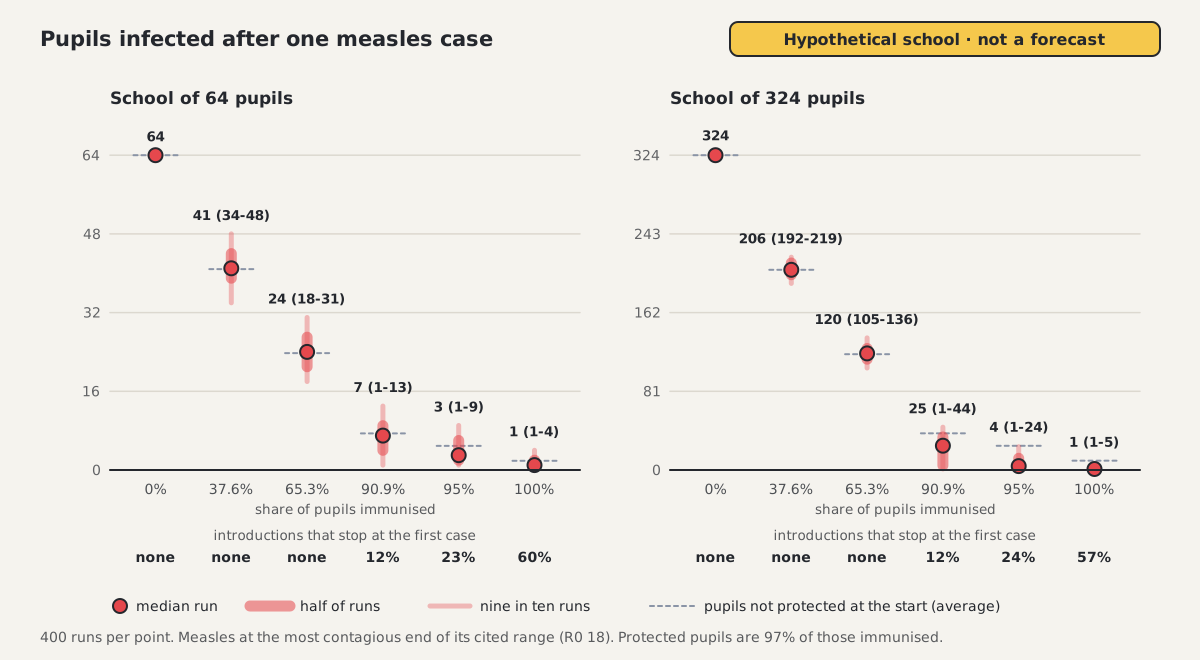
Pupils infected in this model, 400 runs per point. The dashed mark is the number of pupils not protected at the start. Up to 65.3% immunised the dot sits on it: every unprotected pupil is infected.
What decides the outcome in this model is how many pupils are immune on the day the virus arrives.
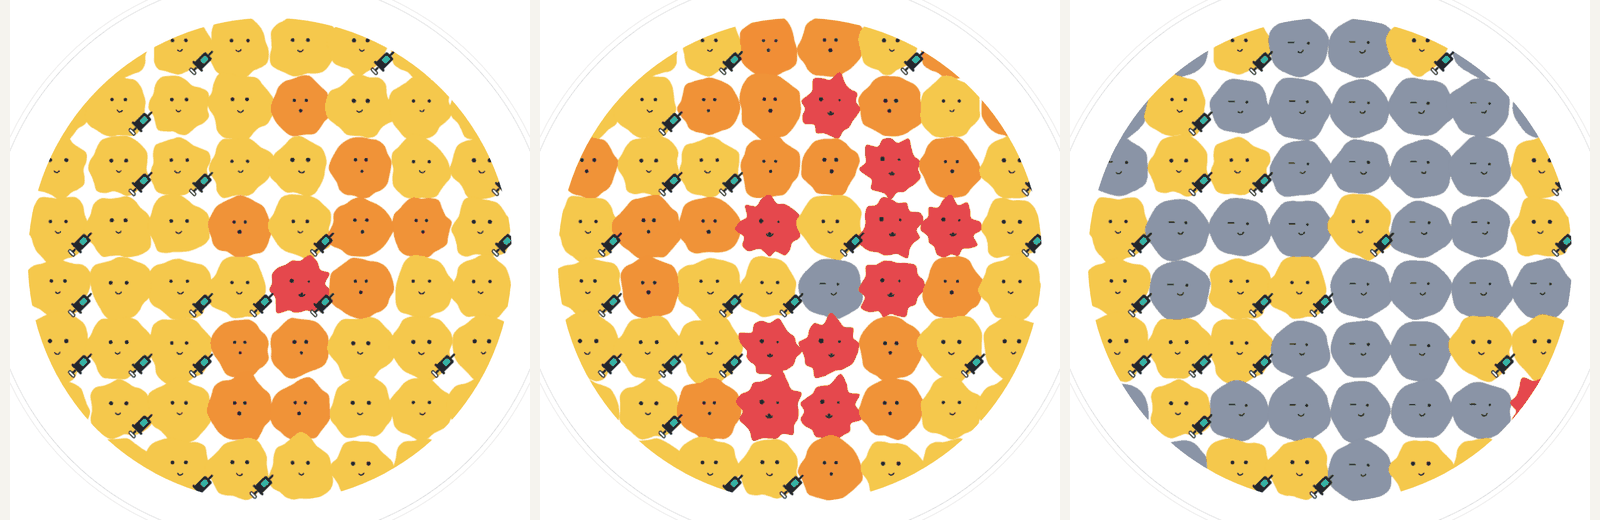
One linked run of the small school with 37.6% immunised, at days 14, 21 and 42. A syringe marks an immunised pupil. Yellow is not yet infected, orange is incubating, red is infectious, grey is recovered. The app counts 11, 30 and 41 pupils infected so far on those days.
Measures that start after the outbreak is noticed
In the model the first case is infected on day 0, becomes infectious on day 8 and has a rash on day 12. I assumed the outbreak is noticed on day 19, seven days after the first rash. In school outbreaks that report it, that gap was 6 to 12 days (van den Hof et al. 2001; CDC 2008).
I tested three measures in the schools with 0%, 37.6% and 65.3% immunised.
- Isolating each case. Each infectious pupil is sent home after four infectious days on average, which is about when the rash appears, and infects nobody for 9 days.
- Excluding unprotected pupils. From day 19, all spread inside the school is cut by 74%, the figure measured for exclusion in one Minnesota outbreak (Banerjee et al. 2022). The simulator cannot take chosen pupils out of the building, so this is a school-wide cut, not exclusion as a health department would order it.
- Vaccinating after detection. On day 22, half of the still-unprotected pupils are vaccinated, and 93% of those become immune at once.
In this model, the measures that start once the outbreak is noticed do little on their own in a mostly unprotected school. Isolating each case from about the day the rash appears leaves the total unchanged (median still 64 of 64). So does excluding unprotected pupils from day 19. Vaccinating half of the unprotected pupils on day 22 lowers the share infected from 100% to 94% in the small school (range 86 to 98%) and to 71% in the large one (range 65 to 75%). All three together: 67% (range 34 to 83%) and 60% (range 52 to 66%).
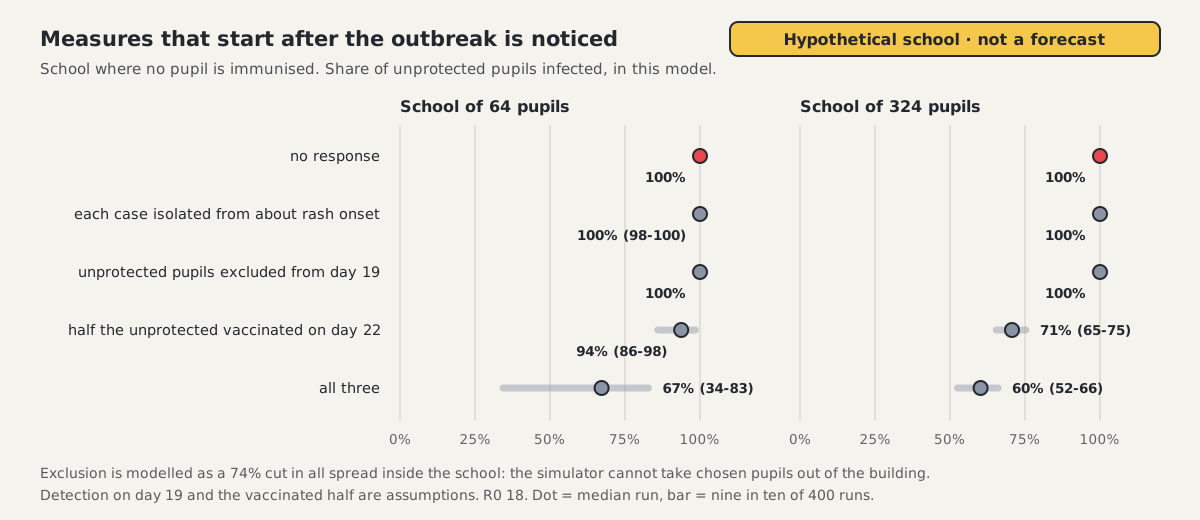
The response arms in the school where no pupil is immunised. The dot is the median run and the bar holds nine in ten runs.
Read that result narrowly. It holds for the most contagious setting, with detection on day 19, in a model that cannot remove pupils from the school, gives the vaccine instant effect and has no homes for excluded pupils to stay in. It does not show that isolation or exclusion fail in practice. What the model can show is timing: by day 19 the first case's contacts are already infected, and each later case has been infectious for four days before the rash gives it away. Real clusters point the same way on timing. In one German outbreak, school and kindergarten clusters where exclusion began at the first case had a median of 3 cases, against 13 where it began at the second (Wadl et al. 2011).
On the rules themselves: New York's regulation lets the health commissioner order exclusion until he or she "determines that the danger of transmission has passed", with no fixed number of days (10 NYCRR 66-1.10). CDC's guidance is exclusion "until 21 days after the onset of rash in the last case of measles" (CDC surveillance manual).
A check, and the cautions
One check on the model itself. In a fully mixed version of the 324-pupil school, the share of unprotected pupils infected matches the textbook final-size relation where that relation gives 99 to 100%, and is within 1 to 9 points of it nearer the threshold (75% against 83% with 90.9% immunised). The grid and the fully mixed school give the same totals, to within one pupil, wherever most pupils are unprotected.
The cautions, plainly:
- The model stops at the school gate. It has no households, so it understates the total; and it has pupils in school every day, which overstates spread inside the school. Published outbreaks in schools with almost no vaccinated pupils report 70 to 91% of susceptible pupils infected (van den Hof et al. 2001; Azimi et al. 2020). The model's 100% is above that.
- In the one outbreak that counted both, in a mostly unvaccinated school, about one case in three was a household member and not a pupil (van den Hof et al. 2001).
- The detection day, the share vaccinated and the instant effect of the vaccine are assumptions. Post-exposure vaccine is known to work only when given within 3 days of exposure, and the evidence is "limited and mixed" (ACIP 2013).
- The sizes of most low-coverage schools are not known, and the typical one that could be matched is smaller than the model's small school.
- "Immunised" is what schools reported to the state.
- R0 18 is the top of the usual range, but one estimate from a single school outbreak is higher, at 30.7 (van Boven et al. 2010). With that value, in the fully mixed school only, 95% immunised gives a median of 21 pupils infected (range 1 to 33) in the large school.
- No teachers, no weekends or holidays, one introduction only.
Run the school in your browser
Five links open the school in the app, each as a single run:
- 64 pupils, none immunised: 54 pupils infected by day 21 and all 64 by day 42.
- 64 pupils, 37.6% immunised: 30 by day 21 and 41 by day 42. This is the run in the frames above.
- 64 pupils, 65.3% immunised: 17 by day 21 and 26 by day 42.
- 324 pupils, 95% immunised: 3 by day 21 and 4 by day 42.
- 64 pupils, none immunised, each case isolated: 45 by day 21 and all 64 by day 42.
Each link carries the whole run: the grid size, the reach of close contacts, the attack rate, the daily whole-school contact, latent period 7 days, infectious period 9 days, the immune share (the vaccine slider, with protection at 100%) and the seed. The fifth also carries the isolation settings. A link shows one run, not the 400 behind the charts, and each of these runs ends inside the middle half of its arm. The exclusion and vaccination arms start mid-run, so no link can carry them. The app shows deaths and a cost figure for every run because the preset has those settings. Neither is a result here, and I project no deaths or hospital admissions.
The same question for a whole county
I first asked this question of a whole county: a hypothetical rural county of about 50,000 people, built to resemble the affected counties in size and vaccination coverage; it is not any real county. The affected counties have between 24,547 and 91,855 residents (Census Bureau 2025 estimates). It gave two pictures.
In the realistic county, 92 to 94% of people of all ages are immune. That share is an assumption, not a measurement. Most introductions of measles go nowhere in the model: 60 to 73% of them end on their own within 12 weeks, and the typical (median) result is 3 to 5 infections. The unlucky runs are larger: 1 in 20 passes 83 to 158 infections.
In the contrast, everyone in the county has the one-dose coverage that some counties report for their two-year-olds. After 12 weeks from one case the model's median is 31 infections at 95% coverage (range 1 to 378), about 700 at 80.9% (2 to 1,923), about 1,600 at 71.2% (235 to 3,829) and about 4,700 at 52.9% (906 to 10,070). No real county looks like that.
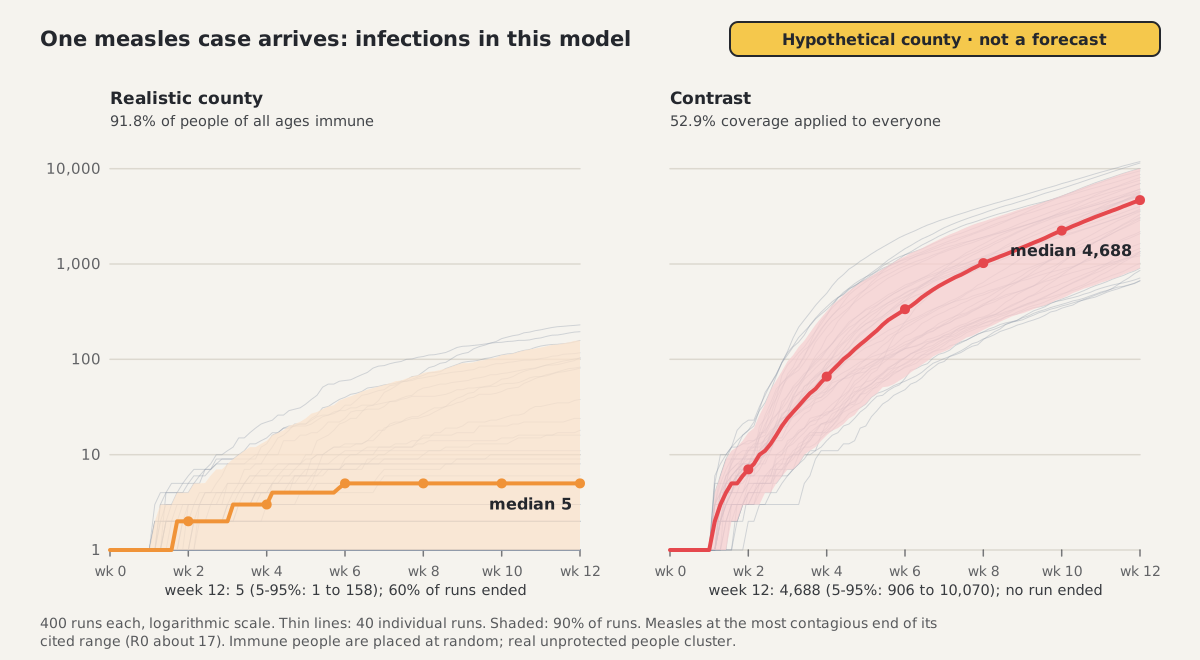
Infections in the county model, 400 runs per panel, on a logarithmic scale. The shaded band holds nine in ten runs; the thin lines are single runs.
The county is the weaker picture, and that is why the school comes first. The simulator spreads unprotected people evenly through a county. Real unprotected people cluster, in schools like the ones above. So the realistic county is probably too reassuring for a county with a real pocket, and the contrast is too alarming for a county as a whole. The truth lies between them, and this model cannot say where.
One check on that model: with fully immune people placed at random, the model's settlement network stops large outbreaks at 94, 92 and 88% immune for R0 of about 17, 12 and 7, against the textbook 94, 92 and 86%.
Two links open single runs of it: the realistic county, 91.8% immune (5 infections; it ends on day 53) and the contrast at 52.9% coverage (3,299 infections by day 84).
What would change the picture
- The sizes of the low-coverage schools. They are known for 61 of 167.
- Real data on who is infected: ages, vaccination status and where cases live. The state has not published them.
- Households. The school model stops at the gate, and homes are where isolation and exclusion do not reach.
- How soon a school outbreak is noticed, and how many pupils are then vaccinated.
- A measured ratio of reported to true cases, and more dashboard snapshots to measure the reporting delay.
Not in the school model at all: deaths, hospital admissions, teachers, households, the community outside, weekends and holidays, and more than one introduction.
Known weakness and later work
The simulator cannot cluster unprotected people inside a county. It places immunity at random, person by person, while real unprotected people live and learn together. That is why the school is the main what-if here: a school is one cluster, and the model can represent one cluster. A county setting that places low coverage in particular towns or schools is the obvious next piece of work. I have not built it.
The school has limits of its own. It ends at the gate, so it leaves out households and understates the total. It keeps every pupil in school every day, so it probably overstates spread inside. Its smallest school has 64 pupils where the typical matched low-coverage school has about 24. It cannot remove chosen pupils, so its exclusion arm is a blunt stand-in.
The fit to the real outbreak rests on few cases, and several quite different settings fit nearly as well. The most recent weeks of data are incomplete, which is why the recreation leaves them out.
The six-week scenarios are scenarios under stated assumptions, not a prediction of what will happen, and they have weaknesses of their own. Run from 22 August, the same method gave central values about twice too high, though the reported counts stayed inside its ranges. The allowance for late reports rests on one pair of dashboard snapshots. The three kinds of fit that drive the wide ranges come from this grid model, and another structure could weight them differently. The scenario fit has no response inside its fitted weeks and no county structure. I will redo the scenarios after the state's dashboard update due on 13 October.
What this does and does not show
- New York State's 2026 measles outbreak is in rural upstate counties: 108 confirmed cases statewide as of 3 October, 7 of them in New York City, which is not described as having an outbreak.
- The recreation is a fit to 61 confirmed cases by onset week, from the week ending 1 August to the week ending 12 September. The total of 61 is scaled to the data and is not a result.
- What the model found: a running total within 3 cases of the data in every week, a start of spread on 18 July on four of five runs, about 2.6 to 4 others infected per case among the people it simulates, and no running out of people.
- That finding is not firm. It rests on 32 to 83 simulated individuals, and several quite different settings fit almost as well.
- The three most recent weeks are incomplete. The recreation leaves them out; the scenarios use them as estimates with ranges.
- The four six-week scenarios are scenarios under stated assumptions, not a prediction of what will happen. They start from about 130 (range 113 to 185). By the week ending 14 November, nine in ten of the model's runs fall between 158 and 929 on the current course, 156 and 513 if the response takes hold, 157 and 377 if the pocket runs low, and 159 and 968 with wider spread. Central values are about 300, 270, 260 and 390.
- Those ranges are wide because the data cannot tell a slowly spreading outbreak from one about to accelerate or one about to run out of people. Run from 22 August, the method's central values were about twice too high, with the reported counts inside its ranges.
- The hypothetical school is a speculative model, for education, not a forecast. It is not any real school.
- In the state's survey, 3,914 of 4,202 schools report at least 95% of pupils immunised against measles and 167 report under 80%. The low-coverage schools whose size could be found typically have about 24 pupils, smaller than the 64 the simulator can make, so shares travel better than counts.
- In the model, a school with no pupil immunised has every pupil infected in every run. With 65% immunised every unprotected pupil is still infected in almost every run. With 95% immunised the typical result is 3 or 4 cases (ranges 1 to 9 and 1 to 24), and with every pupil immunised 6 in 10 introductions stop at the first case.
- Measures that start once the outbreak is noticed do little on their own in a mostly unprotected school in this model. That is a finding about timing at the most contagious setting, in a model that cannot remove pupils. It is not a finding that isolation or exclusion fail in practice.
- What decides the outcome in this model is how many pupils are immune on the day the virus arrives.
- The school model stops at the gate, so it understates the total, and it has pupils in school every day, so it probably overstates spread inside.
- The whole-county version gives 3 to 5 infections where 92 to 94% of all ages are assumed immune, and medians of 31 to about 4,700 (ranges 1 to 378 up to 906 to 10,070) if age-2 coverage described everyone. It spreads unprotected people evenly, so it is the weaker picture.
If you want to see the mechanics for yourself, open one of the links above in the simulator, press play, and try moving the vaccine slider.
Sources
- New York State, Executive Order 65, declaring a disaster emergency due to the ongoing measles outbreak, 5 October 2026. governor.ny.gov; Governor's press release
- New York State Department of Health. Measles Dashboard, data as of 3 October 2026, updated 6 October 2026 (weekly onset series and county totals). health.ny.gov
- New York State Department of Health. Measles Dashboard weekly chart, data as of 12 September 2026, as archived on 18 September 2026. Internet Archive
- County pages, read 7 October 2026: Lewis County Public Health; Chautauqua County clinic listing; Seneca County measles dashboard.
- Comparable outbreaks: Pennsylvania Department of Health measles dashboard, onset weeks as of 7 October 2026; South Carolina Department of Public Health, 2025-26 outbreak counts; Texas DSHS 2025 measles data report; New York State Department of Health on Rockland County 2018-19; the Netherlands 2013-14: Knol M, et al. Euro Surveill 2013;18(36). PDF for the early counts and Woudenberg T, et al. 2017 for the final size of 2,700 cases. PMC5322286 The six-week and final-size multiples are my arithmetic from those counts.
- New York State Department of Health. Health advisory to providers, 21 August 2026. PDF
- New York State Department of Health. Press releases of 24 August 2026 and 15 September 2026.
- New York State Department of Health. Measles pages: guidance and MMR coverage by age 2, by county (registry data as of 1 January 2026).
- New York State School Immunization Survey, 2025-26 school year. health.data.ny.gov
- New York State Education Department. Enrolment files, 2025-26: non-public schools; public schools. The school sizes and class sizes are my tabulation of those files.
- New York State Department of Health. Immunization requirements for school entrance and attendance, 2026-27. PDF
- New York Codes, Rules and Regulations, title 10, section 66-1.10, exclusion in the event of a disease outbreak. Cornell LII
- CDC. Manual for the Surveillance of Vaccine-Preventable Diseases, chapter 7, measles. cdc.gov
- School-linked outbreak in San Diego, 2008: CDC. MMWR 2008;57(8). cdc.gov
- ACIP recommendations on measles vaccine, 2013: MMWR 2013;62(RR-4). cdc.gov
- School outbreak in the Netherlands, 1999: van den Hof S, et al. Emerg Infect Dis 2001;7(3 Suppl):593. article
- Table of earlier school outbreaks: Azimi P, et al. BMC Infect Dis 2020. doi:10.1186/s12879-020-05200-6
- School and household clusters in Germany, 2008: Wadl M, et al. BMC Public Health 2011;11:474. PMC3132164
- van Boven M, et al. Estimation of measles vaccine efficacy and critical vaccination coverage in a highly vaccinated population. J R Soc Interface 2010;7:1537. PMC2988255
- NYC Health. Measles page, count as of 2 October 2026. nyc.gov
- Pennsylvania Department of Health. Statewide update on measles, 2 October
- CDC. Measles cases and outbreaks, updated 2 October 2026. cdc.gov
- CDC. Pink Book, chapter 13, measles. cdc.gov; clinical overview; vaccine effectiveness
- News reports: Spectrum News, 6 October 2026; Gothamist, 5 October 2026; New York Times via the Philadelphia Inquirer, 6 October 2026; WSKG, 10 September 2026; WBNG, 9 September 2026; 13WHAM, 5 October 2026.
- United States Census Bureau. County population estimates, vintage 2025. census.gov
- Delamater PL, et al. Complexity of the basic reproduction number (R0). Emerg Infect Dis 2019;25:1-4. article
- Guerra FM, et al. The basic reproduction number (R0) of measles: a systematic review. Lancet Infect Dis 2017. doi:10.1016/S1473-3099(17)30307-9 (abstract only)
- Vink MA, et al. Serial intervals of respiratory infectious diseases: a systematic review and analysis. Am J Epidemiol 2014;180:865. article (abstract only)
- Fitted R0 in a 2018-19 outbreak, and the adult immunity assumed in the county model: Yang W. Sci Adv 2020;6:eaaz4037. PMC7272232
- R0, response and vaccination figures for a 2014 outbreak in Ohio: Gastañaduy PA, et al. Am J Epidemiol 2018;187:2002. accepted manuscript
- Banerjee E, et al. Impact of isolation and exclusion as a public health strategy to contain measles virus transmission during a measles outbreak. Clin Infect Dis 2022;75:152. article