How I made a browser epidemic simulation 45x faster
From 347 to 15,707 ticks per second in one browser: an O(N) sweep deleted, a Rust/WebAssembly core, a WebGPU kernel, and three backends that must agree.

MemeLab is an epidemic simulator that runs in your browser: a grid where every cell is a person, every tick is a day, and infection spreads by dice rolls between neighbours. A 320×320 dish is 102,400 people. The first post here is about why it exists. This one is about making it fast.
Two weeks ago the engine was a single TypeScript loop that visited every cell, every pass, every tick. Today the same simulation has three interchangeable engines behind it: the original TypeScript, a Rust core compiled to WebAssembly, and a compute shader running on the graphics card via WebGPU. On the same dish they are 7.3×, 10.6× and 45× faster than where I started.
They are interchangeable for speed, not for replay. All three are deterministic: the same settings and the same seed always give the same epidemic. The first two give the same epidemic as each other, tick for tick. The GPU gives a different one, because thousands of threads draw their random numbers in a different order. So swapping CPU for WASM gets you the same run, faster, and swapping either for the GPU gets you a different valid run of the same model. That is the right trade for a parameter sweep and the wrong one for replaying a permalink somebody shared. More in the GPU tier.
None of this was speed for its own sake. A dish running at a few hundred
ticks per second is a toy you nudge: set a slider, watch, set another one.
Almost everything I want to build next is the opposite. Bigger dishes, so a
grid can stand in for a region rather than a neighbourhood. More happening per
cell, since the genome work in docs/ga-spec.md gives each strain real
structure, and structure is paid for on every cell of every tick. And above
all, runs nobody sits and watches: parameter sweeps, inverse fits, an agent
that forms a question, runs a few thousand worlds and comes back with an
answer. Tick rate decides whether that last one is a research loop or an
overnight job I never start.
This is the engineering log, and the numbers in it are not quoted from old notes. Because the engine's history is in git and the benchmark's workload has not changed a byte since the day I wrote it, I can check out each stage of the work as a separate worktree and run the identical benchmark against all of them, back to back, on one machine. That is what every table and chart below is. Where I quote a planning document or a commit message instead, I say so. The code is public at github.com/TheMemeticist/MemeLabV3; the app is at epi.meme.
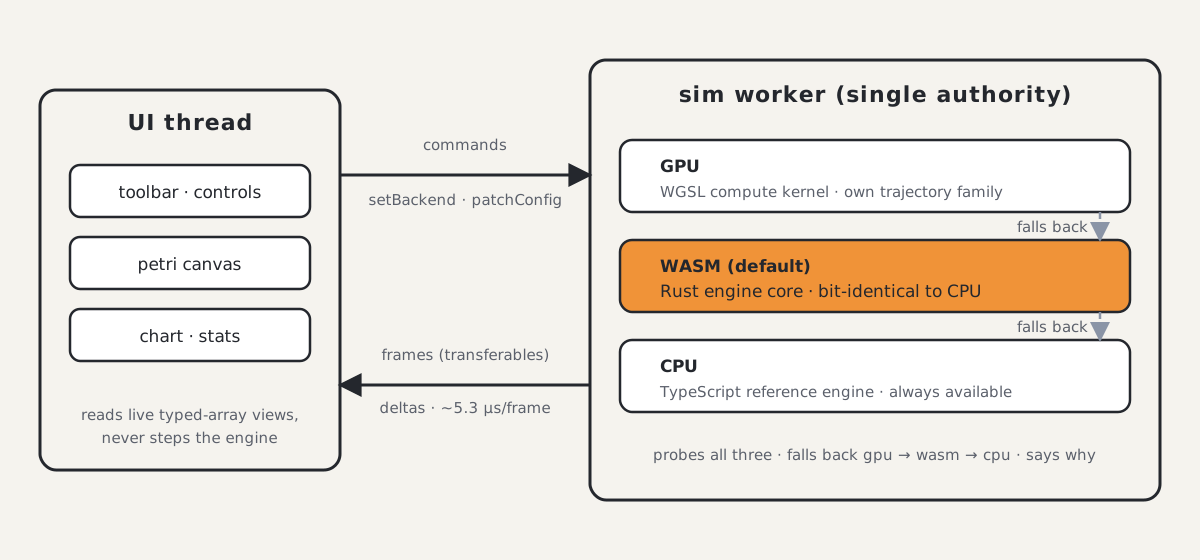
The UI thread never steps the engine. One worker owns all three backends, probes them, falls back gpu → wasm → cpu, and posts frames as transferables.
The starting point
Before optimizing anything I wrote the benchmark: a 320×320 dish held at endemic steady state, meaning immunity wanes fast enough that the infection never burns out and the engine never gets to coast. Quarantine on, a little mortality and birth, a fixed seed, 200 warm-up ticks and 300 measured. Because the engine is deterministic, every run measures the identical workload, so a difference between code versions is real and a difference between runs is noise.
One thing up front, because it changes every number below. Every figure here is measured on the production bundle: in a browser where the browser can run it, and under plain Node where a figure needs the per-pass profiler. Never under vite-node, which is not a neutral observer of this code: it distorts these measurements by up to 3.4×, and unevenly. I take that apart in the harness is part of the result.
Re-running the pre-optimization commit that way gives 346.9 t/s on a square
lattice, about 2.9 ms per tick. The plan (docs/wasm-plan.md) was "maybe port
the hot loop to WASM", gated on transmission being more than 60% of tick time.
Transmission was a fifth of it and the life-cycle sweep was around 70%, so an
infinitely fast WASM transmission pass would have bought at most 1.25×. I
wrote "no WASM port" into the plan and went looking for the real problem.
A V8 tick profile (node --prof) pointed at the enums: esbuild does not
inline cross-module const enum members, so every CellState.Infectious
comparison in the hot loop compiles to a runtime property load, 47 of them in
the pre-optimization engine. Hoisting the enum values and this.tick into
per-step locals, plus a single-strain fast path and an interior-cell fast
path, gives a modest and completely real win, bit-identical in output:
| geometry | pre-optimization | after TS round | speedup |
|---|---|---|---|
| square | 346.9 t/s | 440.2 t/s | 1.27× |
| triangular | 414.8 | 504.3 | 1.22× |
| hexagonal | 305.0 | 389.1 | 1.28× |
| voronoi | 303.2 | 374.8 | 1.24× |
| meanfield | 238.6 | 313.4 | 1.31× |
The shape of the problem hadn't changed, though. A sweep over every cell was still dominating a tick in which almost nothing actually happens.
Here is the whole road, with the two stages still to come, measured the same way in the same hour so the bars are comparable to each other and not just to their own footnotes:
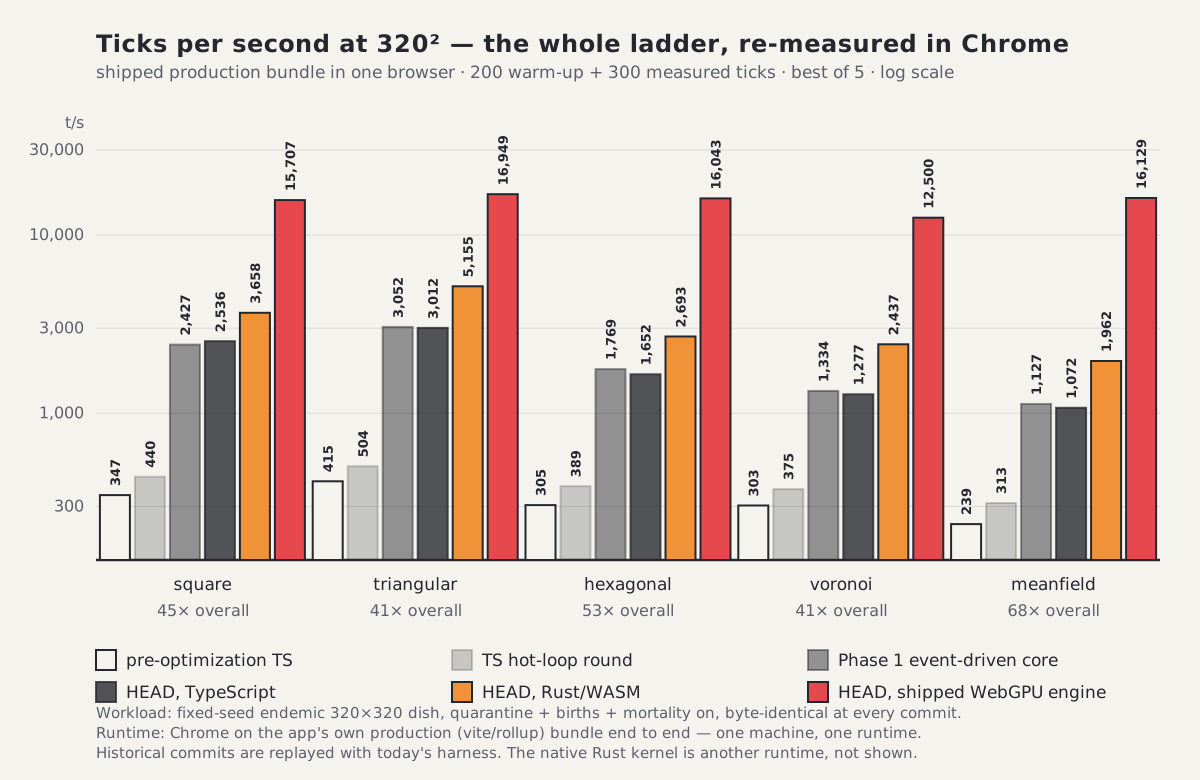
Every bar measured in the same browser on the same workload. The overall multipliers under each geometry run from 41× on voronoi and triangular to 68× on mean-field.
The invariants I refused to break
Determinism. A given (config, seed) must replay the same trajectory on
a given engine version: permalinks encode the seed and the R₀ estimator
compares candidates on common random numbers. "Forever" would be the
stronger promise, and I broke it once, deliberately; see the re-pin below.
The RNG is xoshiro128** seeded via splitmix32, and tests/rng.test.ts pins
its raw output stream for fixed seeds.
One seed, two runs, the same trajectory. That is the property every optimization below had to preserve.
Golden digests. A digest is a fingerprint of an entire run.
tests/engine-golden.test.ts steps a 48×48 dish for 150 ticks on each of the
five geometries and hashes the whole stats stream, every count on every tick,
down to one number per geometry, pinned in the file. Any change that moves a
single count on a single tick fails the suite. The rule I wrote down: a digest
is re-pinned only for a documented, deliberate change to what the simulation
does, never to make a red test green.
Zero-copy buffers. The engine exposes its state as live views into memory rather than copies, the worker hands the grid to the UI thread by transferring ownership instead of duplicating it, and history is sent as deltas rather than whole snapshots: 5.3 µs per frame today against 612 µs for a full snapshot at 600 ticks, which is 0.32 ms/s of posting at 60 fps instead of 37 ms/s.
Phase 1: stop visiting cells that aren't doing anything
Commit perf: event-driven engine core (5.1x), golden-digest test suite, wasm/GPU gate spikes is the one that changed the algorithm. The
measurement that motivated it (docs/perf-plan.md): at endemic steady state
on 320², only ~3.35% of cells change state per tick (about 3,400 of
102,400), yet every pass visited all of them. ~55,000 random() calls per
tick, 86% of them the per-tick waning Bernoulli on recovered cells. A
prototype that removed those draws but kept the sweep gained only 7%. The
cost was in walking the grid, not in rolling the dice. The walk itself had to
go.
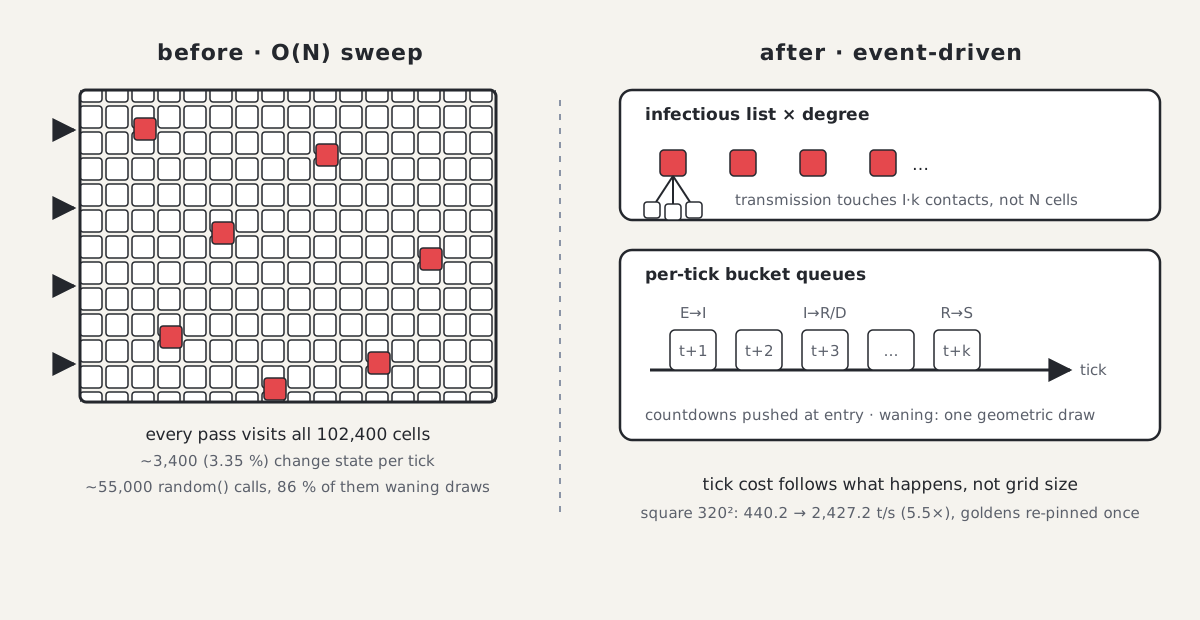
Before: every pass visits all 102,400 cells. After: transmission touches I × degree contacts and every countdown sits in a per-tick bucket.
The event-driven core keeps explicit lists of the infectious and the dead, so transmission only walks the contacts of infectious cells instead of the whole grid. The timed transitions, exposed to infectious and infectious to recovered or dead, are countdowns dropped into a queue for the tick they fire on. Waning immunity is the interesting one. Rolling a die every tick until it comes up is mathematically the same as drawing the waiting time once, so that is what I do:
/** Geometric waiting time (support 1, 2, …) for per-tick hazard p — the
 *  number of per-tick Bernoulli(p) trials up to and including the first
 *  success. One draw replaces the old draw-per-tick loop, with the identical
 *  distribution. */
private geometricDelay(p: number): number {
  if (p >= 1) return 1;
  const u = this.rng.random();
  return 1 + Math.floor(Math.log(1 - u) / Math.log(1 - p));
}
The census became incremental (increment/decrement at each transition), and
mean-field collapsed its per-susceptible Math.pow loop into a cohort table.
This is the one place I re-pinned the goldens, and I did it once. The statistics are unchanged; the individual runs are not, because there are fewer and different dice rolls. That has a cost worth stating plainly: a permalink minted before this commit no longer replays to the same outbreak after it. Averages still hold. The specific outbreak somebody bookmarked does not. The commit documents the check: distribution equivalence against the old engine over 30 seeds × 2 geometries × 5 outcome metrics, all consistent, with one metric at z = −2.4 that replicated at z = −0.01 on 60 fresh seeds. Stepping the commit and its parent side by side:
| geometry | before P1 | after P1 | speedup |
|---|---|---|---|
| square | 440.2 t/s | 2,427.2 t/s | 5.51× |
| triangular | 504.3 | 3,051.9 | 6.05× |
| hexagonal | 389.1 | 1,768.9 | 4.55× |
| voronoi | 374.8 | 1,333.9 | 3.56× |
| meanfield | 313.4 | 1,127.4 | 3.60× |
The commit message claims 5.1× on square and the gate table in perf-plan.md
claims 4.3× on voronoi, against my 5.51× and 3.56×. Those were measured on a
different machine; the two columns above are the same workload on the same
silicon, minutes apart.
The more interesting number is not the ratio but the shape. The whole reason for "no WASM port" was that the pass a port is good at, the flat branch-light transmission sweep, was only a fifth of the tick. Removing the life-cycle sweep did not just make the tick smaller. It inverted what the tick is made of:
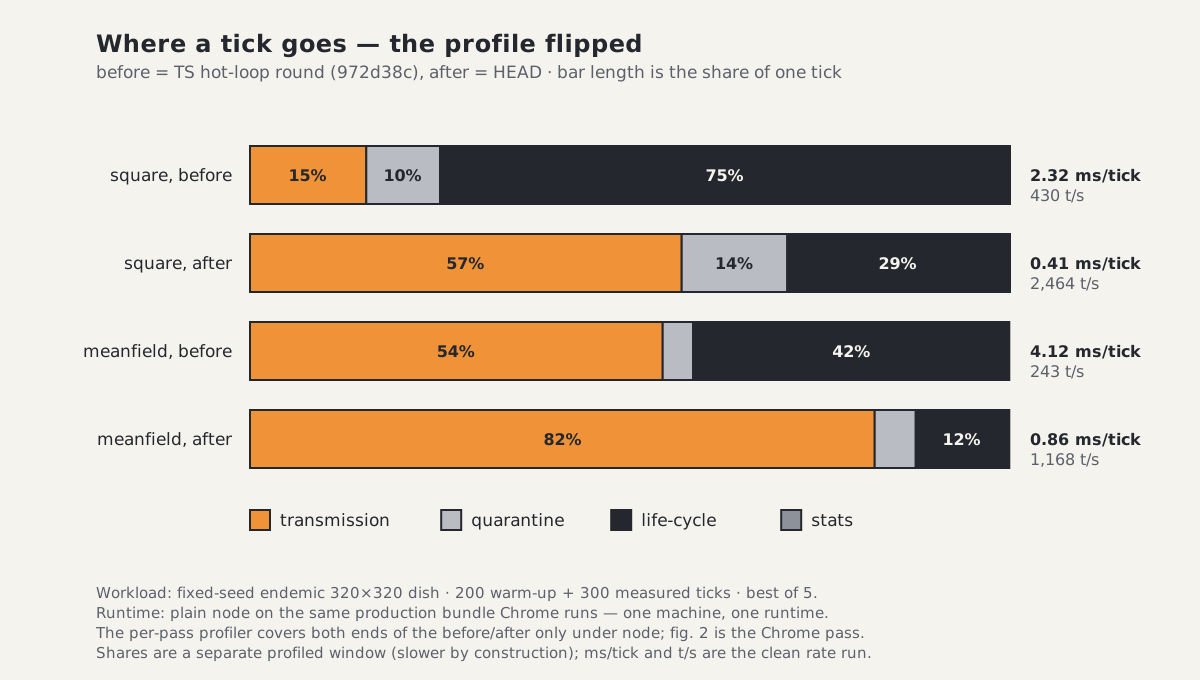
The same four passes, before and after. Life-cycle went from 75% of the tick to 29%, and the tick itself got 5.7× shorter, so the pass that survived is the one a vector unit or a GPU can actually help with. This is the one figure measured under plain Node rather than in the browser, because the per-pass profiler is the only instrument here that does not exist at both ends of the comparison in Chrome.
That is the sentence that reopened the WASM question. The plan's 1.25× ceiling was a fact about the old profile, not about WASM.
The fit path was construction-bound
The R₀ estimator runs thousands of short trials. Commit perf(fit): reuse engine buffers across trials: 3.5x faster R0 estimator fits found each
trial built a fresh Engine (~1 MB of allocations, including a 4,096-row
history ring); burnout candidates paid almost pure construction.
Engine.reset() now reuses every buffer at unchanged grid size and each fit
worker keeps one engine. The commit recorded a GA fit (population 20 × 8
generations, K = 15, 40 posterior draws) going from 30.6 s to 8.7 s. Two tests pin that a reset
engine is bit-identical to a fresh one.
The end-to-end fit runs in browser workers, so I can't replay it headlessly
across four checkouts the way I can the tick loop. What I can replay is its
inner loop (runTrials(60 days, K = 5) at the 128² grid a real fit uses)
for the two candidate shapes a GA actually sweeps, in milliseconds per trial:
| candidate | after TS round | after P1 | today |
|---|---|---|---|
| square, range 1, spreading | 9.19 | 1.14 | 1.18 |
| voronoi, range 3, burnout | 14.08 | 3.45 | 5.01 |
| voronoi, range 3, spreading | 43.33 | 33.67 | 9.45 |
From the WASM commit onward the fit path picks the WASM engine when there is one, so the last column changes backend as well as code.
Two readings. The first row is where the WASM core buys nothing: at 128² from a single index case most ticks are almost empty, so the per-trial fixed costs are the whole bill and a faster tick has nothing to bite on. The third row is the opposite. It did not improve at Phase 2 either, sitting at 35.6 ms/trial at the WASM commit, because voronoi had no WASM path yet and fell back to TypeScript. It dropped to 9.45 only when the CSR neighbour tables landed a commit later, so the estimator's worst candidate got 3.6× faster because of a change I made for the renderer's geometry. That is the kind of thing you only notice if you keep a benchmark.
Phase 2: a Rust core that shares the RNG stream
With the right algorithm in place, the WASM question got a different answer. A scalar Rust port of the Phase-1 tick, square lattice only, spiked at 3.34× the TypeScript engine the day I wrote it, and came out trajectory-exact: identical dice rolls, identical epidemic. That was the surprise. Matching the TypeScript engine exactly was supposed to be the hard part.
Commit feat(engine): WASM and WebGPU backends with toolbar selector
landed the real thing: rust/engine-core, a line-faithful port of the
event-driven engine covering the full single-strain feature surface
(defenses, lockdown, quarantine contact tracing, births, waning,
txSchedule, patchConfig, reseed). It's compiled once by rust/build.sh
and committed as a base64 module, so the web build never needs a Rust
toolchain.
Same tiles, same order, faster lane: the WASM core runs the identical algorithm on the identical RNG stream.
The trick that makes it bit-identical rather than merely equivalent: the
TypeScript seed() function writes the initial population directly into
WASM linear memory, then hands over the RNG state.
// Seed the population with the TS seed() writing straight into wasm
// memory — identical draws, identical layout.
const rng = new Rng(config.seed);
const pop = {
  state: new Uint8Array(buf, ex.state_ptr(), n),
  defenses: new Uint8Array(buf, ex.defenses_ptr(), n),
  // ...
};
seed(pop, rng, { /* uptake, compliance, patient zero */ });
const s = rng.snapshot();
ex.set_rng(s[0], s[1], s[2], s[3]);
From there the Rust core runs the identical xoshiro128** algorithm in the
identical draw order, and the neighbour tables (parity offset tables for
lattices) are copied in from the TypeScript geometry layer verbatim. There
is no second digest family: tests/wasm-engine.test.ts asserts the WASM
engine reproduces the same goldens as the TypeScript engine.
Voronoi came a commit later (wasm engine: voronoi support via per-cell CSR neighbor tables — bit-identical, 2.5x). Irregular geometries don't have
offset tables, so the TS layer builds compressed-sparse-row neighbour lists
per cell (direct CSR at range 1, BFS discovery order beyond) and the core
iterates them in that exact order. Quarantine contact-tracing gets a second
CSR table that is only materialized while quarantine is enabled.
TS versus WASM on the bench workload in the browser, best of five runs each, with a parity check across all 501 ticks of every pair:
| geometry | 320² TS | 320² WASM | ratio |
|---|---|---|---|
| square | 2,535.9 t/s | 3,658.5 t/s | 1.44× |
| triangular | 3,012.0 | 5,154.6 | 1.71× |
| hexagonal | 1,652.0 | 2,693.0 | 1.63× |
| voronoi | 1,276.6 | 2,437.0 | 1.91× |
| meanfield | 1,072.2 | 1,962.1 | 1.83× |
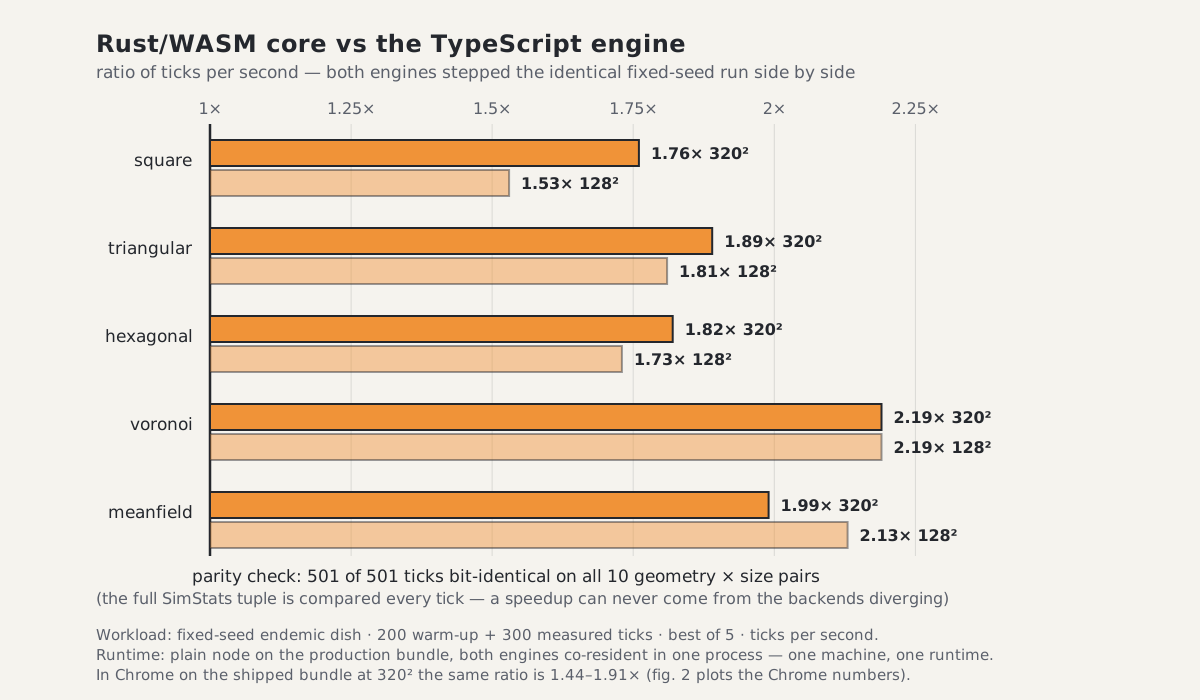
The bars are the ratio; the line under them is why the ratio means anything. These are the Node figures, because that is where the tick-by-tick parity check runs with both engines co-resident in one process, which is also what makes the ratio a fair one. The table above is the same comparison in Chrome, and it is slightly tighter.
The parity check is not a formality bolted on afterwards: it runs in the same
harness that produces the numbers, on the same configs, and it compares the
whole SimStats tuple every tick rather than a final total. If a bar in that
chart ever got taller because the WASM core quietly stopped doing some of the
work, the run would report a broken tick index instead of a speedup.
The gradient across geometries is the shape of the win: the more the tick is transmission, the more WASM helps, which is exactly what the profile above predicted. Mean-field is 86% transmission, voronoi is close behind, and both gain about 1.9×; square is 59% transmission and gains 1.44×.
wasm-plan.md set a ≥2× kill criterion for the port. In the browser it lands
at 1.44× to 1.91×, and only in a Node process with both backends co-resident
does the top of the range reach 2.19×, so it misses that bar. I kept it anyway,
for two reasons that are not the benchmark: it is bit-identical, so it is safe
to make the default, and the estimator's fit workers get the whole of it.
Phase 3: the GPU tier
WebGPU was never about a faster 320². It is a different tier, 1024² to
2048² dishes at interactive rates, gated on a throwaway spike beating the CPU
engines by ≥5×. That spike was a native Rust binary talking to Vulkan
directly, and it cleared the gate easily, which is all it was for. The number
that belongs in the ladder is the one the app ships: the WGSL kernel in
src/sim/gpu-engine.ts, driven from a browser, does 15,706.8 t/s at 320²
and 472.7 t/s at 2048², which is 4.19 million cells, on the same protocol as
everything above. The native spike is about 24% faster, because it never reads
anything back and the shipped engine has to hand cells to a renderer.
Same-seed runs gave identical 500-tick histories, a different seed diverged,
and the population stayed exactly conserved at every size I tried.
The 320² figure understates the point, so here is the whole sweep, all three backends on the same workload and the same protocol:
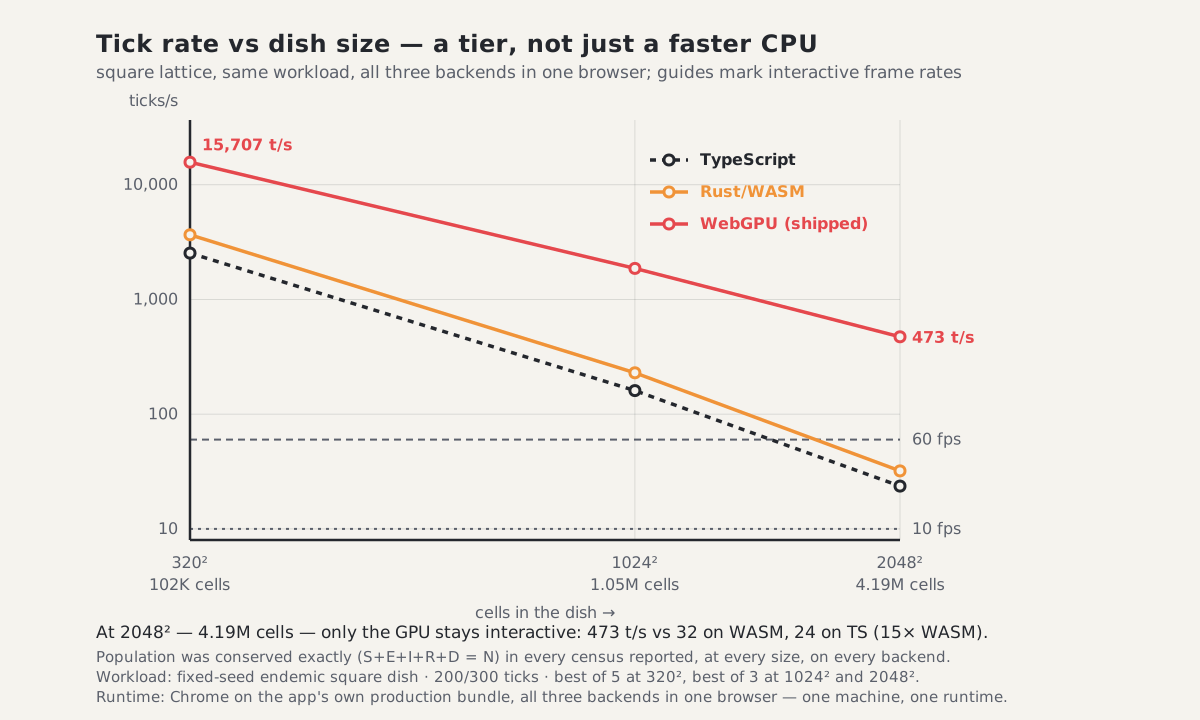
Dashed guides at 60 and 10 ticks per second. At 4.19 million cells the GPU is still at 473 t/s while WASM is at 32 and TypeScript at 24, so only one of the three is still interactive.
The three lines are close to parallel, which is the useful part: no backend has a different scaling story, they just start from different constants. What separates the GPU is where it runs out of memory bandwidth, and that shows up better as throughput:
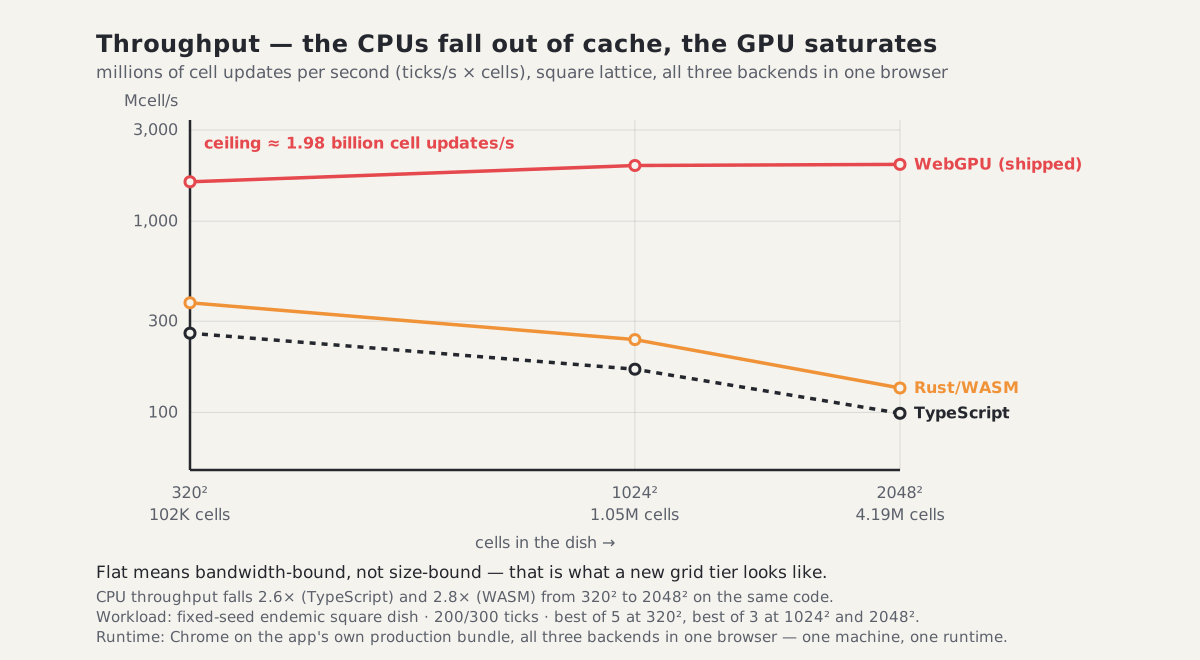
Cell updates per second: ticks/s × cells. TypeScript loses 2.6× and WASM 2.8× between 320² and 2048² as the working set outgrows cache. The GPU climbs to about 1.98 billion and stays there, which is what "bandwidth-bound" looks like on a chart.
That flat red line is the argument for the tier. A CPU backend gets slower per cell as the dish grows; the GPU does not, so the cost of a bigger dish is paid once, in wall-clock, and never again in efficiency.
The kernel design follows from the determinism rule:
- Gather, not scatter. Each susceptible cell's thread reads its infectious neighbours and decides its own fate, rather than infectious cells reaching out to write into their neighbours. Same probabilities, one write per thread, and no need for atomic operations.
- Counter-based RNG. A sequential random-number stream is meaningless across 100,000 threads running in no particular order, so instead of drawing in sequence the kernel computes each cell's random number from its coordinates, the tick and the seed. Integer arithmetic in WGSL is exactly specified, so the run reproduces regardless of the order the GPU happens to schedule things in.
- Batched dispatches. Up to 2,048 ticks per submit, one readback per batch.
The honest consequence: the GPU engine is deterministic per
(config, seed, txSchedule) but in its own trajectory family. It can't
share the CPU/WASM goldens; the draw order is different by construction. So
the CPU engine stays the reference and the GPU is validated on conservation
and on same-seed reproducibility.
Shipping it taught me three things the spike didn't.
Eight storage bindings. Baseline WebGPU allows only eight storage
buffers per stage. Per-cell words are packed (state + infection age in one
u32, defense flags + compliance in another) and the kernel sits at seven.
Never copy a buffer onto itself. Commit gpu: voronoi support via CSR in the shared tables buffer; fix silent same-buffer copy killing all dispatches found a real production bug. Rolling each batch's final census
row into row 0 was encoded as copyBufferToBuffer(stats → stats). WebGPU
forbids same-buffer copies, and Dawn's response is to invalidate the whole
command buffer. Every dispatch died silently in Chrome: the day counter
advanced while stats, chart and cells stayed zero. The headless harness never
hit it because it encoded its own copies. The fix bounces through a one-row
carry buffer:
// A direct stats→stats copy is a WebGPU validation error (same src and
// dst buffer invalidates the WHOLE command buffer — every dispatch above
// dies silently), so bounce it through the one-row carry buffer.
enc.copyBufferToBuffer(this.bufs.stats, n * STATS_STRIDE * 4, this.bufs.carry, 0, STATS_STRIDE * 4);
enc.copyBufferToBuffer(this.bufs.carry, 0, this.bufs.stats, 0, STATS_STRIDE * 4);
The same commit brought voronoi to the GPU. The CSR lists ride the same single tables buffer as the lattice offset tables, with segment descriptors reinterpreted as offsets-base + list-base, which keeps the binding count at seven. The gather formulation stays valid because voronoi adjacency and its BFS range expansions are symmetric. Today the shipped engine does 12,500 t/s on voronoi against 15,707 on square at 320², a 20% divergence cost.
Adapters lie. On Linux Chrome the default gives no adapter;
#enable-unsafe-webgpu hands you SwiftShader, which is slower than WASM.
Commit gpu: refuse software WebGPU adapters (SwiftShader) rejects software
adapters so the fallback message can name the real fix,
chrome://flags/#enable-vulkan. WebGPU also needs a secure context, so the
app says "needs HTTPS or localhost" instead of failing generically. The
worker is the single authority: it probes all three backends, falls back
gpu → wasm → cpu, and the toolbar picker shows each as running, fell-back
with the reason, or unavailable with why.
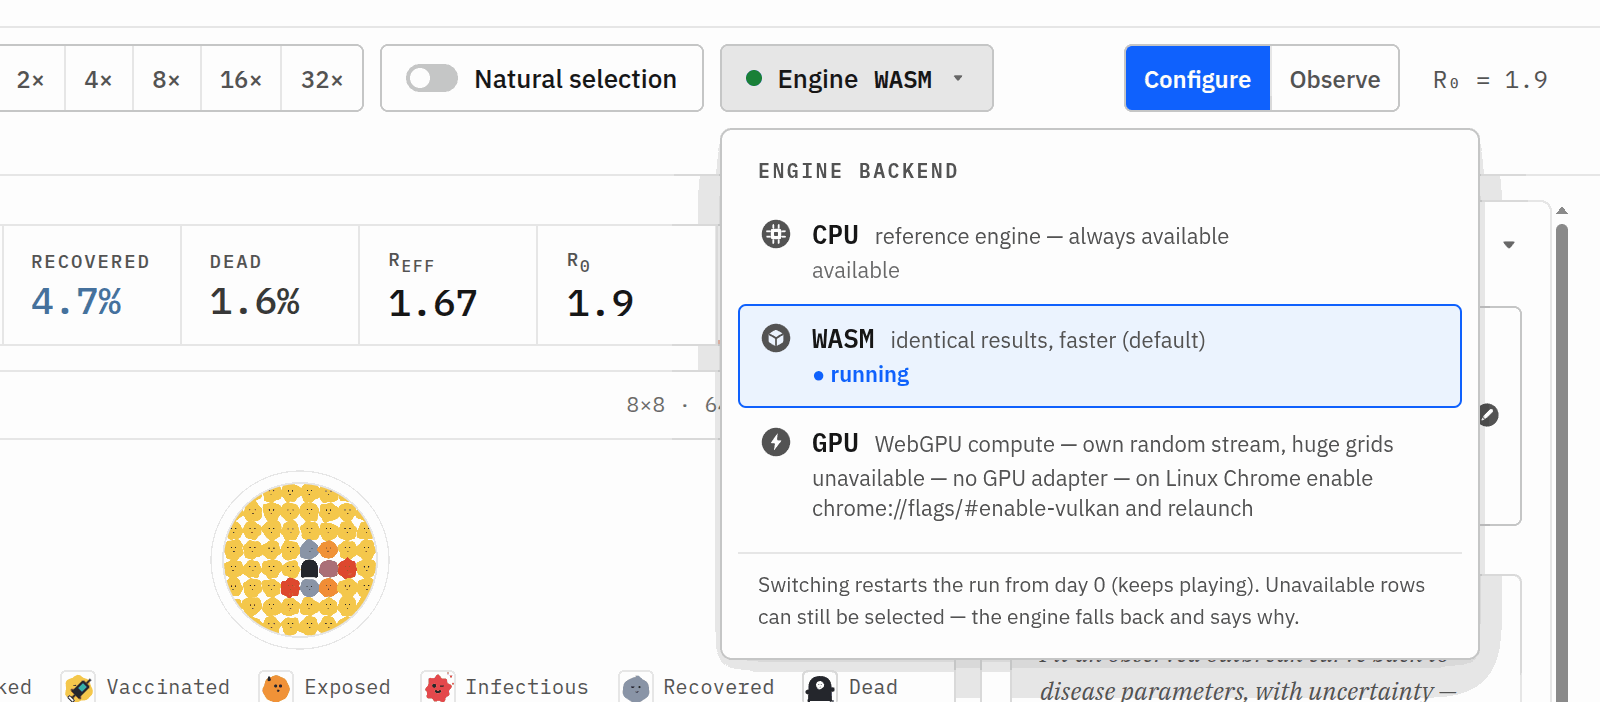
The toolbar's engine menu on a Linux Chrome without Vulkan: WASM running, GPU unavailable, and the row says exactly why.
What the test suite proves
npx vitest run on the current tree: 9 files, 162 tests, 2.3 s. The suites
that matter for a scientific simulator, and the invariant each one guards:
| suite | tests | protects |
|---|---|---|
rng.test.ts | 12 | pinned random-number output for fixed seeds; snapshot and restore resume the identical stream |
engine-golden.test.ts | 27 | hashes of the 150-tick stats stream on all five geometries; exact SEIR timing; reset() reuse and a no-op patchConfig leave the trajectory untouched; buffers() are live views, not copies |
wasm-engine.test.ts | 17 | stats and cell-buffer parity with the TS engine on every geometry, holding through mid-run config changes, extinction reseed and quarantine; conservation every tick |
engine.test.ts | 25 | conservation S+E+I+R+D = N under churn; Dead is absorbing at zero birth rate; every defense blocks spread across long endemic runs |
fit-apply.test.ts | 3 | the estimator's "Apply" replays the representative trial seed bit-exactly |
fit.test.ts, ga.test.ts, cost.test.ts, url-state.test.ts | 78 | estimator loss/CI behaviour, GA operators, cost model, permalink round-trips |
The parity suite is the one I'd point a skeptic at. It doesn't check that
WASM is "close": it steps both engines side by side for 200 ticks and
requires every stat, then the entire state and quarantine buffers, to be
equal. A change to engine.ts that isn't ported to rust/engine-core fails
CI rather than silently forking the simulator.
What the suite can't prove: that the GPU family is distributionally identical to the CPU one. There is no headless WebGPU in vitest, so the kernel is validated on hardware before ship, not on every commit. It also can't re-verify that Phase 1's trajectory redefinition was distributionally sound. That was a one-time statistical check. And the goldens are 48×48 for 150 ticks; a bug that only shows at 320² past tick 1,000 would slip through.
The harness is part of the result
npm run bench runs the benchmark under vite-node, and vite-node is not a
neutral observer of this code. Here is one commit, one workload, one protocol,
with nothing changed but the module pipeline:
| commit | production bundle | esbuild, enums inlined | vite-node |
|---|---|---|---|
| pre-optimization | 345.2 t/s | 361.9 | 100.4 |
| after the TS round | 443.2 | 440.8 | 377.1 |
| after Phase 1 | 2,546.0 | 2,496.7 | 1,786.1 |
vite-node costs the pre-optimization engine 3.44× and the event-driven one 1.43×. The asymmetry is the trap: a harness that penalises one version more than another turns a 1.28× change into an apparent 3.76× one, and the inflation looks exactly like a real optimization.
The mechanism is specific enough to be worth naming. Vite's SSR runtime installs every export as an accessor rather than a data property:
Object.defineProperty(__vite_ssr_exports__, "CellState", {
  enumerable: true, configurable: true, get() { return CellState },
});
So under vite-node every CellState.Infectious in the hot loop is a getter
call followed by a property load, per read, per cell, per tick. A node --prof of the pre-optimization engine puts Builtin: LoadIC at 41.8% of
ticks and that one export getter at another 14.4%. The same source built the
way it ships puts LoadIC at 0.2% and spends 83.8% of its time inside
stepSpatial and computeStats, which is where a simulation should be
spending it.
Which is why hoisting those enum reads is worth 1.28× and not the larger number a vite-node profile suggests. The property loads are real; most of what the profiler was pointing at belonged to the harness.
npm run bench still exists, with a comment at the top saying what it is
not. It is a fine relative signal between two commits inside one runtime.
It is not a number to publish.
Where the numbers land
Square 320², cumulative, every row measured in the same browser on the same workload:
| stage | t/s | vs. previous | vs. start |
|---|---|---|---|
| pre-optimization | 346.9 | — | 1× |
| TS hot-loop round (bit-identical) | 440.2 | 1.27× | 1.27× |
| Phase 1 event-driven core | 2,427.2 | 5.51× | 7.0× |
| today's TypeScript engine | 2,535.9 | 1.04× | 7.3× |
| Phase 2 Rust/WASM core (bit-identical) | 3,658.5 | 1.44× | 10.6× |
| Phase 3 WebGPU engine | 15,706.8 | 4.29× | 45× |
A 56× version of that last cell exists, from dividing the native Rust spike by the browser baseline, but it crosses a runtime boundary in the middle of a multiplication. Nobody gets 56× by opening the app.
Two things the table doesn't show. The first is that the biggest single jump came from deleting work rather than from a faster language: Phase 1 is 5.51× and it is pure TypeScript, which is more than the Rust core and the GPU kernel achieved individually. The second is the tier: 2048² runs at 473 t/s on the GPU against 32 t/s on WASM, so the largest dish the app offers is only interactive on one of the three backends.
Against the version people actually used
That ladder is internal to one codebase. The longer arc is the 2021 JavaScript build, which was a working web app rather than a rewrite target, and whose simulation core still runs unmodified. Driving that core directly at the same 320² dish, past the ten-ticks-per-second display timer and the population slider that stops at 100×100, it does 44.8 t/s in the same browser. Against 15,707, that is about 350×.
Both caveats point the same way. The 2021 model has no quarantine pass, so it does less work per tick than the current one and 350× understates the like-for-like gap. And a far bigger number is available if you count what a user felt, because that build was pinned to ten ticks per second and could not open a dish past ten thousand cells. That one describes a product rather than an engine, so it is not the number I am claiming either.
What's next
The Rust transmission pass is still scalar; 128-bit SIMD is the obvious
untapped headroom. The GPU census still uses a per-thread atomicAdd and
eight hash calls per cell; a workgroup-histogram reduction is known headroom.
wasm threads need COOP/COEP headers, and the fit loop is already parallel
across plain workers. Integrated-GPU validation of the WebGPU tier is still
open.
The reason to want them is the R₀ estimator, which is the closest thing this project has to a non-human user. Nobody watches a fit: it states a question as a loss function and then consumes simulations by the thousand, a couple of thousand short runs before the posterior draws even start. It is already the heaviest consumer in the app, and every hour of this work went into its budget. Its inner loop went from 9.19 ms per trial to 1.18 on the spreading square candidate, and from 43.33 to 9.45 on the worst voronoi one. That is the difference between a question you ask once and a question you can afford to ask in a loop.
Scale that up and the shape of the next phase is visible. A strain with a real genome makes each tick more expensive; a region-sized lattice makes each tick bigger; and a driver that explores rather than watches wants thousands of both. The three backends exist so that those three demands can be met at the same time instead of trading off against each other: the GPU tier for size, the WASM core for the fit workers' throughput, the TypeScript engine as the reference that keeps all of them honest. Determinism is what makes it usable by a machine at all: a search is only meaningful if the same question, asked twice, gets the same world back. None of the speed above would be worth much without that, which is why every phase of it was gated on parity rather than on the benchmark.
Reproduce it
git clone https://github.com/TheMemeticist/MemeLabV3
cd MemeLabV3
npm ci
npx vitest run          # 162 tests: goldens, RNG, WASM parity, fit contracts
BENCH_REPS=5 npm run bench:browser   # TS, WASM and WebGPU in a real browser
BENCH_REPS=5 npm run bench:ladder    # the whole ladder, straight from git history
Those two benchmark commands produce every table and chart above. Every figure
is best of five repeats, which is what BENCH_REPS=5 buys you; the harness
defaults to three.
bench:ladder checks each historical commit out into a worktree, grafts in the
current harness, builds every one of them through the same production pipeline,
and prints the ladder. The graft works because the harness core imports nothing
outside src/sim/ and src/types.ts, which is the property that lets a
pre-optimization commit be measured with today's protocol.
Each runner prints the final census next to the tick rate, and that census is
the receipt: two runs that end on the same S/E/I/R/D stepped the same
trajectory and can be compared, and two that do not, cannot, however close
their tick rates look.
The harness is
tests/bench/,
and tests/README.md
documents the protocol and the runtime trap above. npm run bench is still
there and still runs under vite-node: use it to compare two commits, not to
quote a number.
To try the backends live, open epi.meme, click the
engine button in the toolbar, and pick CPU, WASM or GPU. If GPU shows as
unavailable, the tooltip tells you why: on Linux Chrome it is almost always
chrome://flags/#enable-vulkan plus an HTTPS origin.